You can use LPSM Search to view the log results from various devices and machines connected to the Director setup. It is the consolidated location to look up and monitor the log results of search queries of multiple Fabric-enabled LogPoint instances. You can search for logs using the LogPoint query language.
Search Page
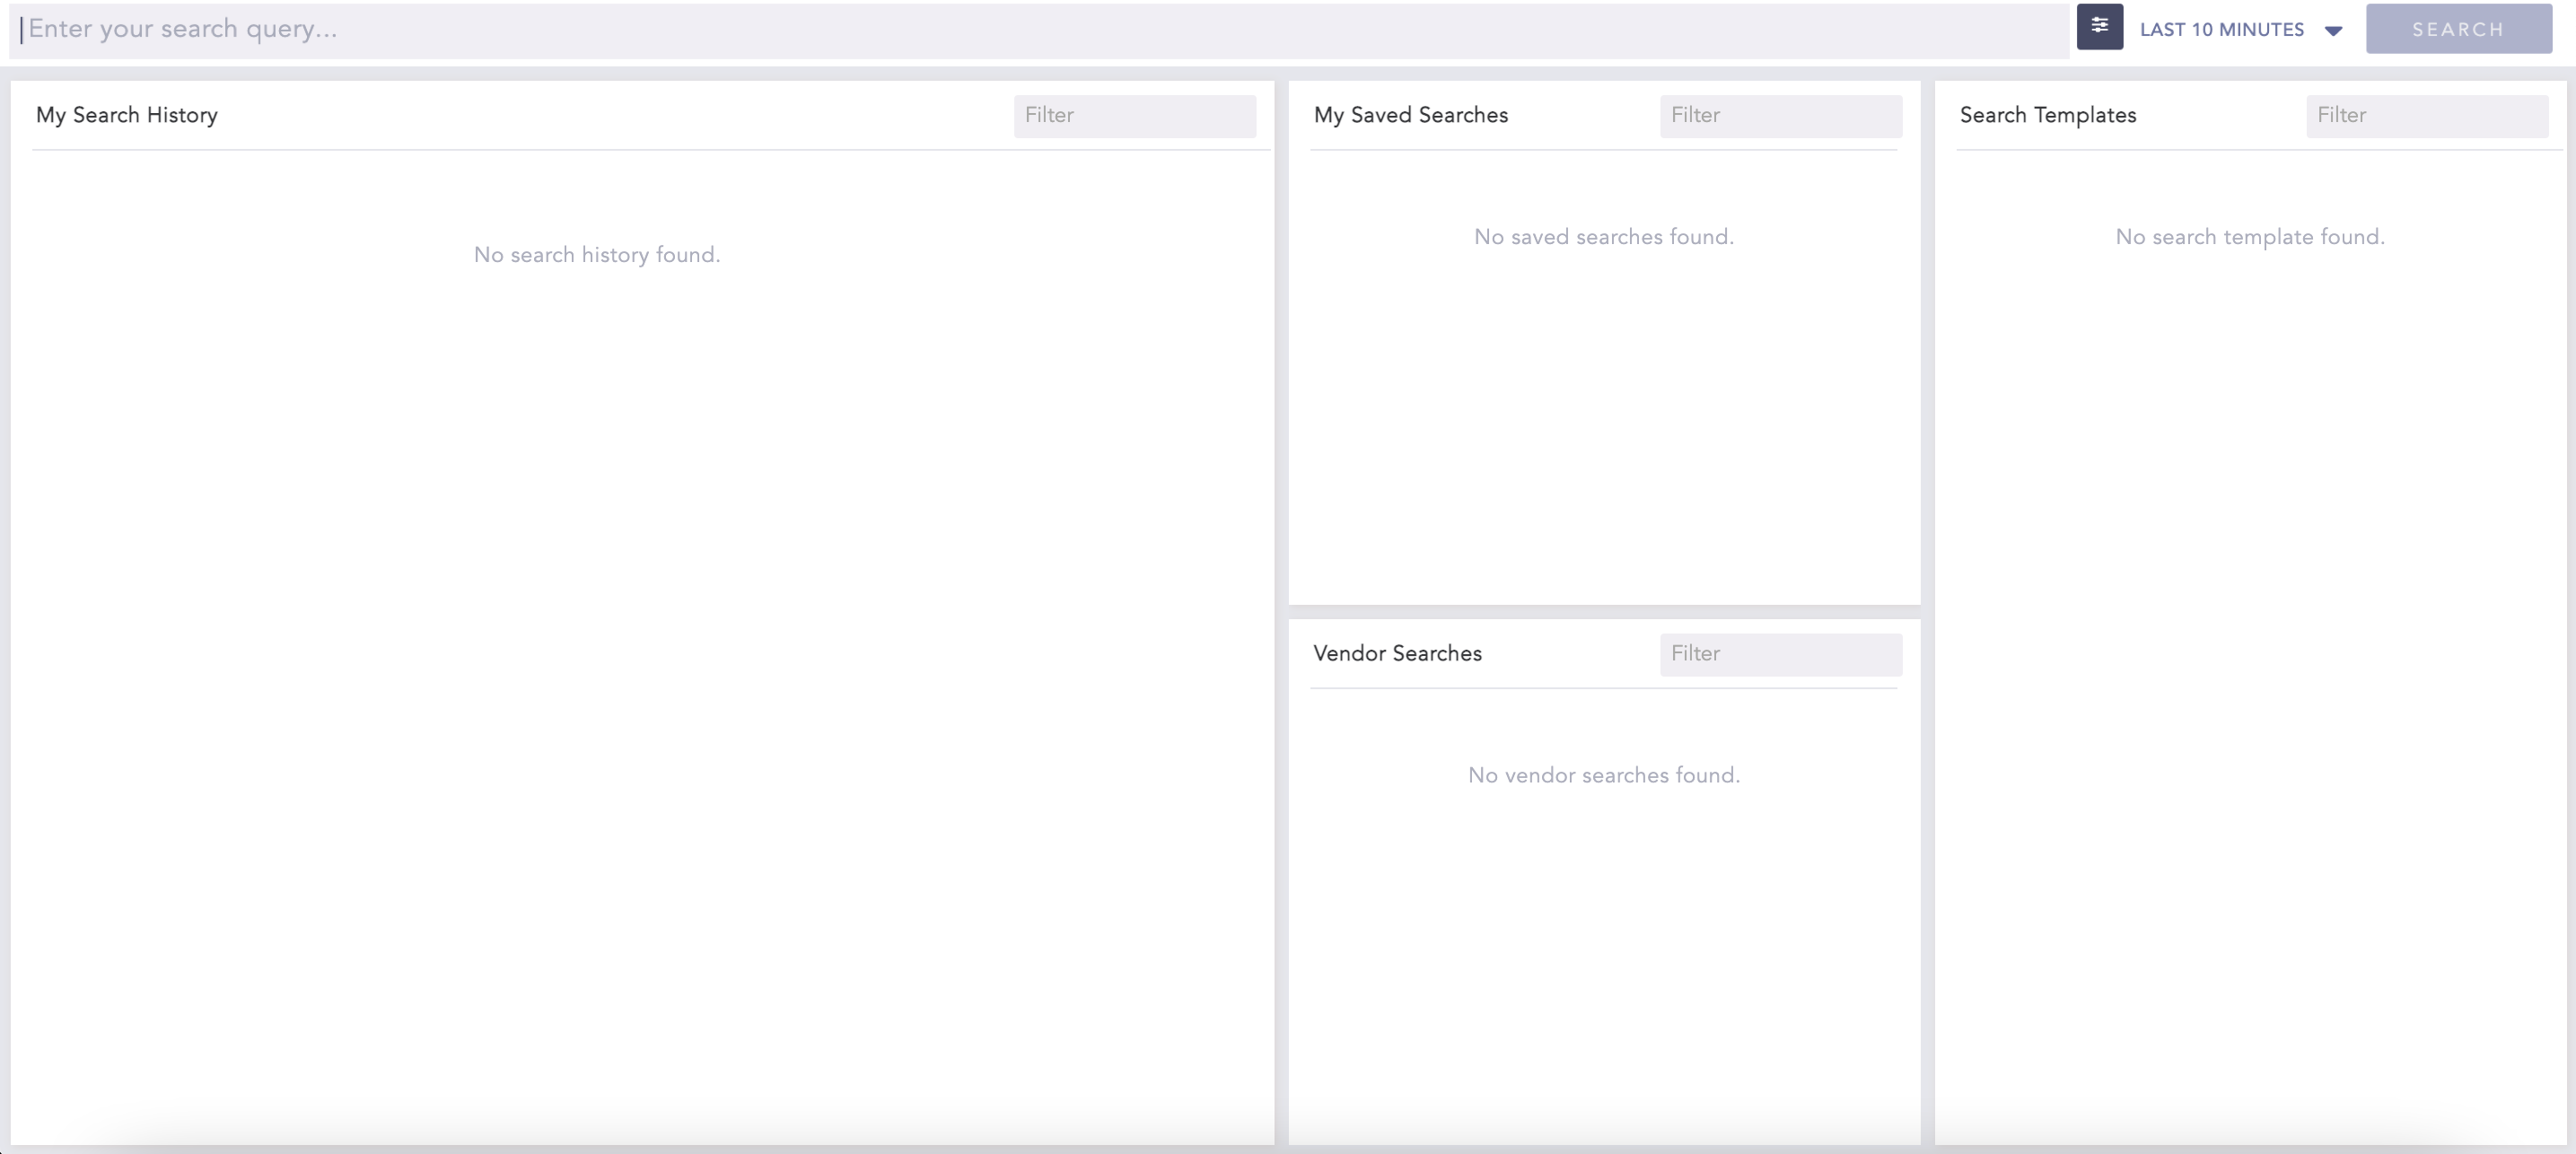
The Search page contains four sections where you can use the Filter text-box to filter the searches performed.
My Search History lists the recent search queries executed in the LogPoint Search Master. Click a search from the list to automatically add it to the search bar and display the results.
My Saved Searches lists the saved search queries in the Fabric-enabled LogPoint instances. Click a saved search from the list to automatically add it to the search bar and display the results.
Search Templates lists the search templates created in the Fabric-enabled LogPoint instances. Clicking a template opens the search template page.
Vendor Searches lists the search queries provided by the vendor. Click a vendor search query to automatically add it to the search bar and display the results.
You can search for indexed logs of Fabric-enabled LogPoint instances by setting the Query String, Time range, and Search Options.
You can search logs by using a Query String that you enter in the Query Bar.

Query Bar
The query string is a logical combination of words, phrases, or field values. You can enter a simple query string or build a search string to aggregate different values in the search result and display the result in a graphical format.
Note
Refer to the Search Query Language section for more details about query strings.
You can write multiple commands into a single query by using the pipeline (|) character.
You can write queries in multiple lines in the query bar. Press Shift + Enter to add a new line.
You can select the Time range and apply it to your search. The default time range is Last 10 minutes. You can also choose a range from the Last x time-range template or select a time range from the Custom range picker for searches. The custom time ranges such as Last 1 hour, Last 6 hours, and Last 7 days are available in the drop-down.

Time Range
The Search Options button in the upper-right corner of the Search Bar allows you to select the search options for a search.

Search Options Button
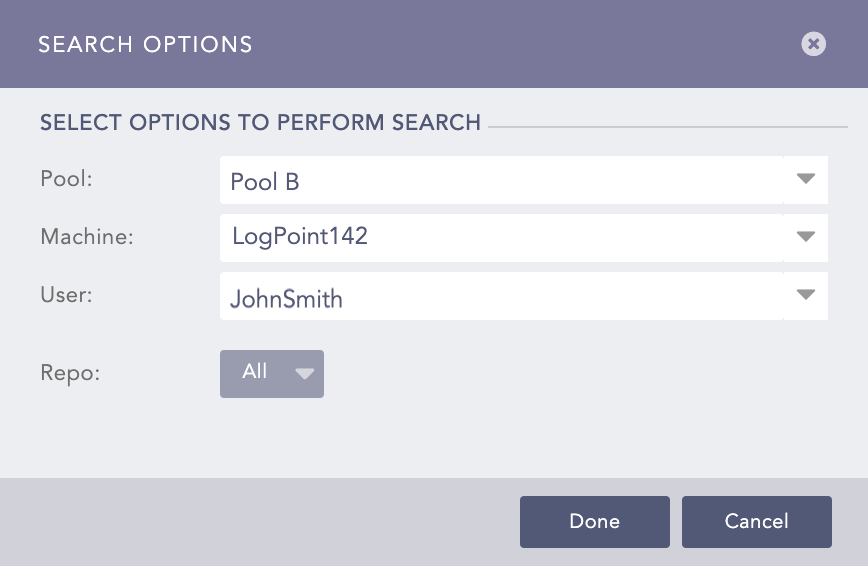
Search Options Panel
Using the Pool, Machine, User, and Repo options, you can search for logs of a specific repo of a Fabric-enabled LogPoint present in a pool.
LogPoint pool is a collection of Fabric-enabled LogPoint instances. The Pool option populates all the pools created in the LPSM.
You can associate multiple machines with a LogPoint pool. Once you select the LogPoint pool, the Machine drop-down populates all the Fabric-enabled LogPoint instances linked to the pool.
User lists all the LogPoint users of the selected LogPoint. LPSM executes the search on behalf of the selected LogPoint user.
The repo selector lets you select the repositories to search logs. You can select multiple repositories by clicking the All drop-down. However, for better performance, you are recommended to select only those repos that you require.
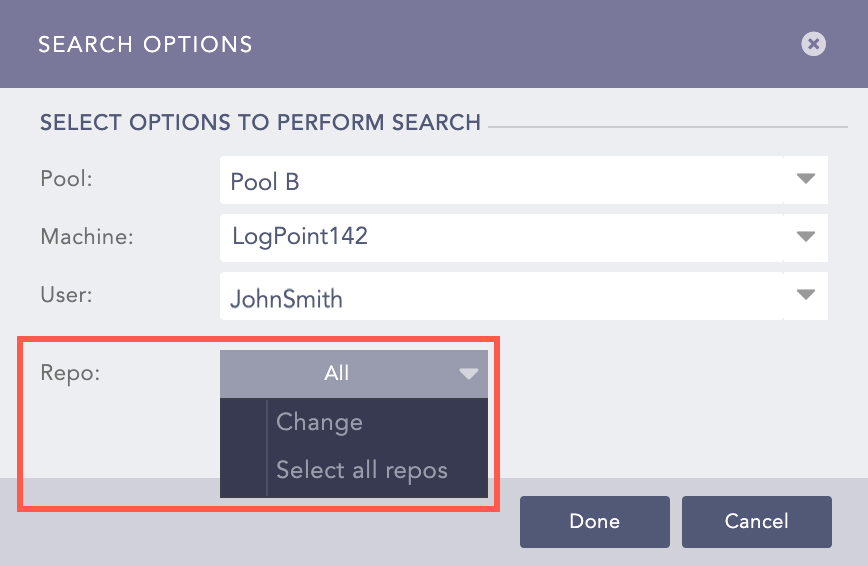
Repo Options
Click the Change option to open the Repo Selector panel, which lists all the available repos.
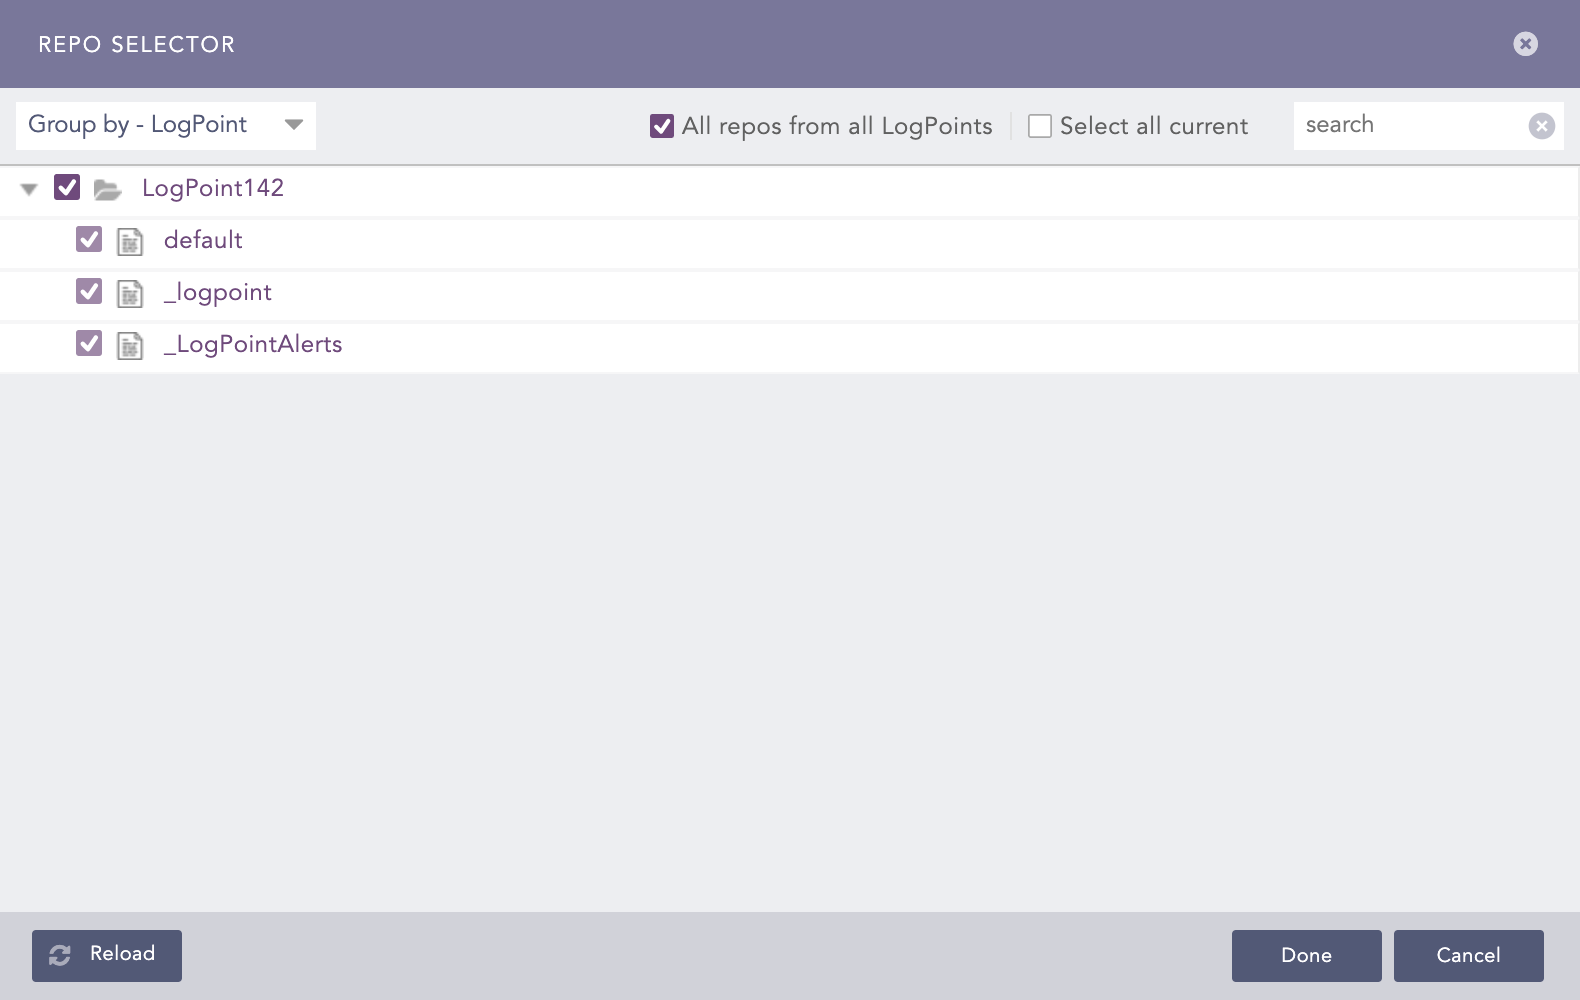
Repo Selector Panel
When you select the Group by - LogPoint option, all repos within the Fabric-enabled LogPoint instances in the Director setup are displayed. Similarly, when you select Group by - Repo option, all the LogPoint instances associated with the repos are displayed.
Note
Click Search Options and select the Pool, Machine, and the Repo to enable the Search button.
Select the Search Options and enter a search query in the query bar.
Click Search.
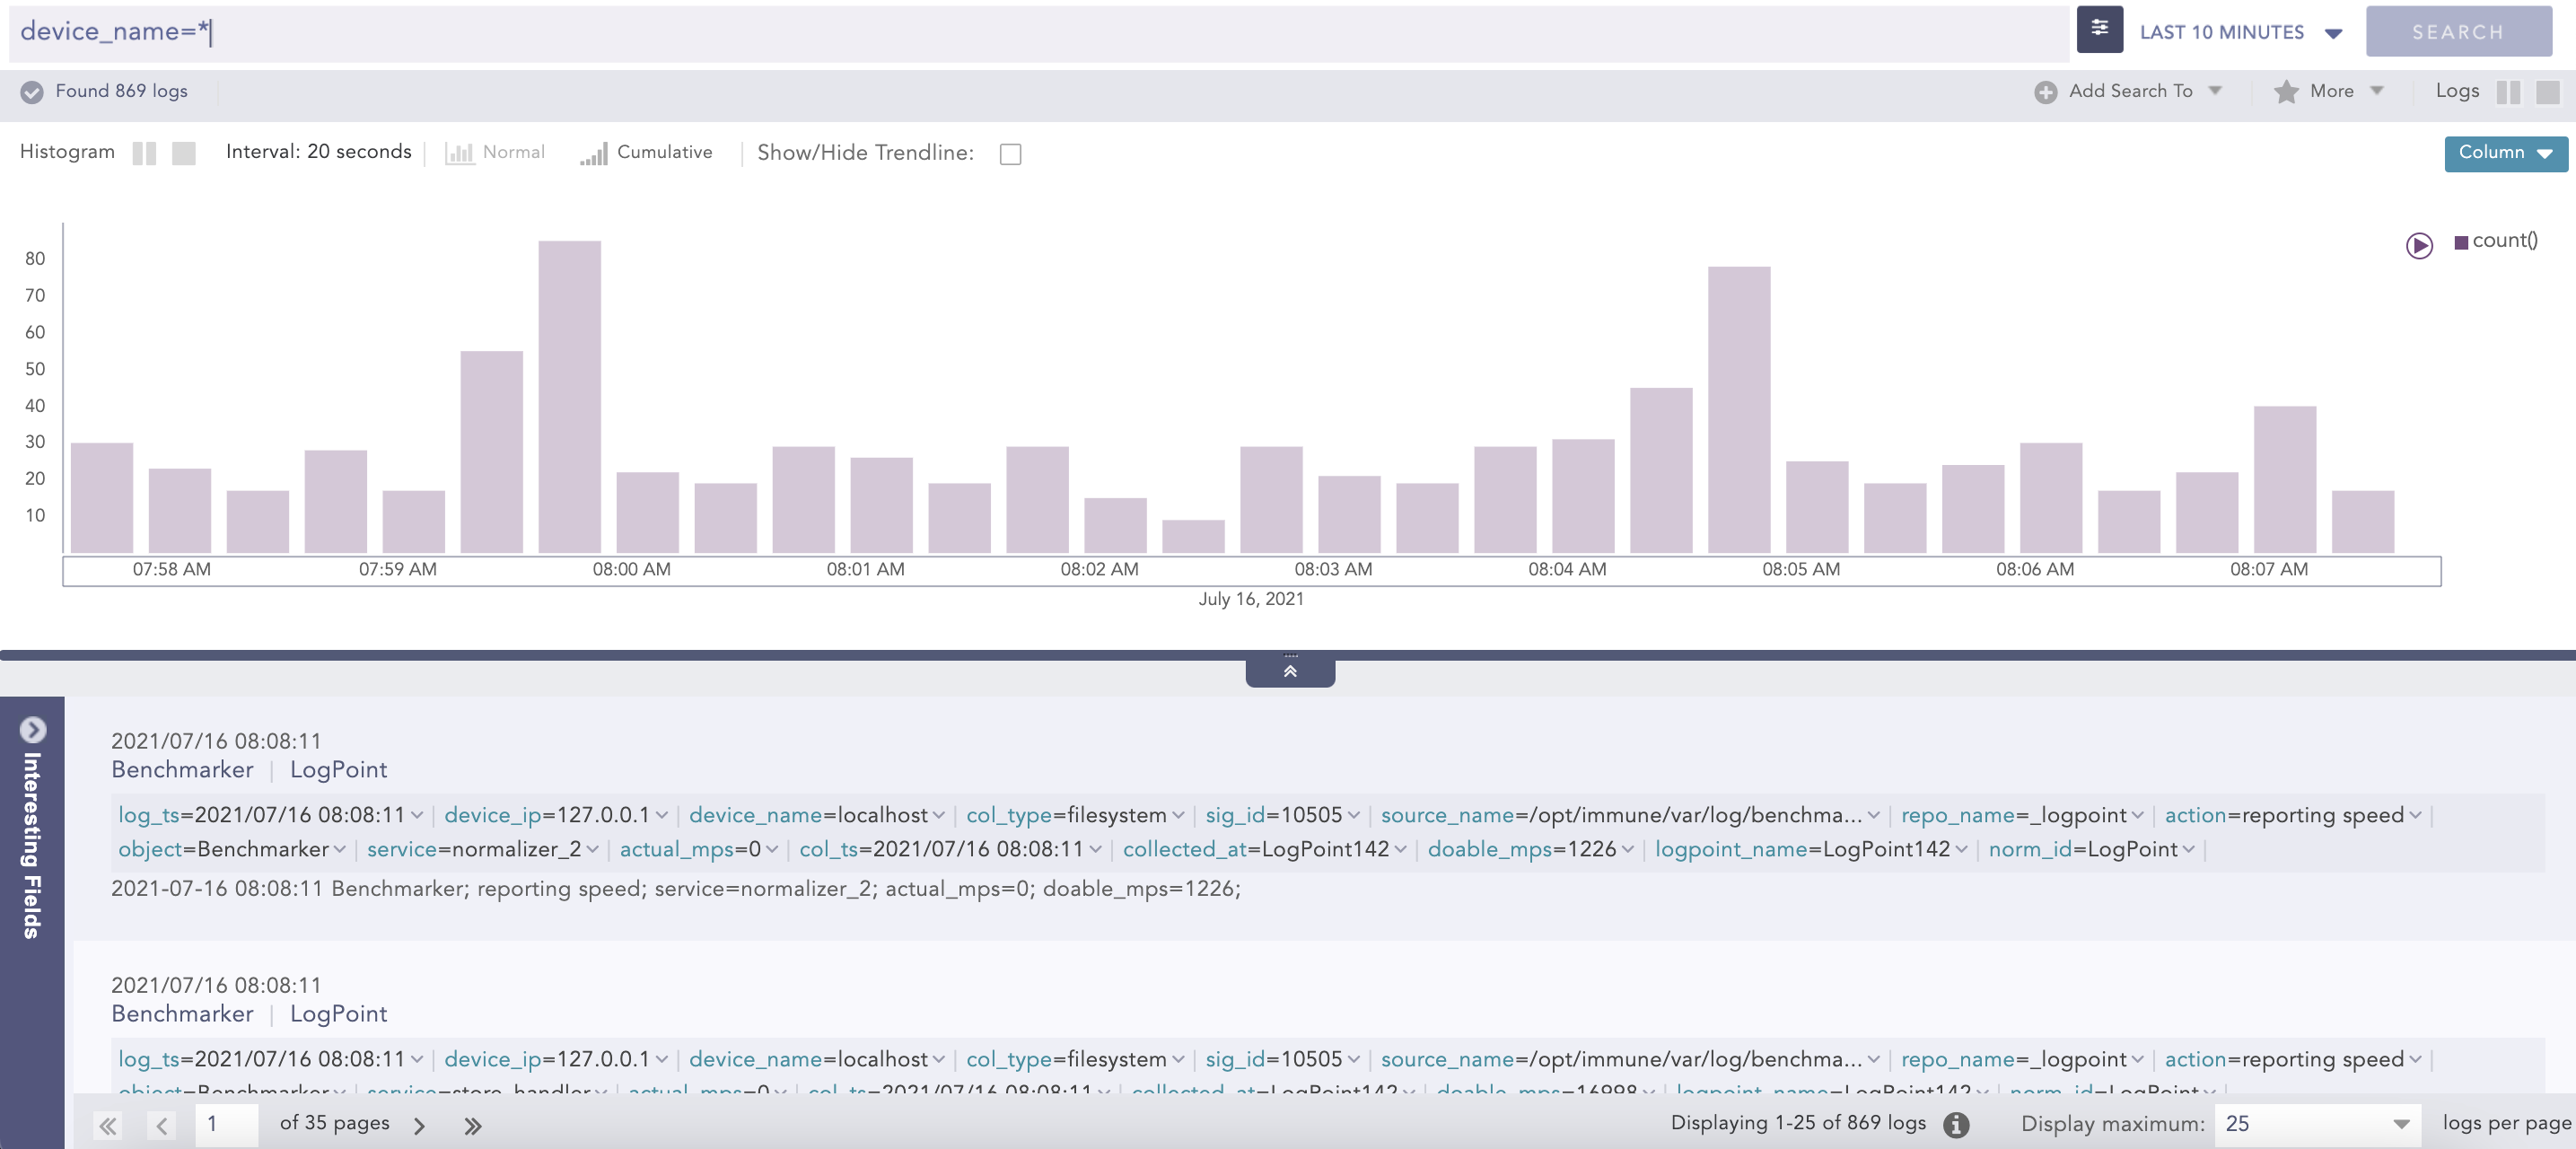
Search Result
Note
After you perform a search, you can drill down the search result by clicking on the content of the results. Refer to the Drilldown section for more details.
Refer to the Visualization in LogPoint section for details on the Extended Visualization Framework.
Refer to the Interesting Fields in LogPoint section for details on the Interesting Fields.
You can use the Add Search To Dashboard option to create a dashboard widget from the search query. You can then add this widget to an existing or a new dashboard.
Go to the Search page.
Select the Search Options and enter a Search Query in the query bar.
Click Search.
Click the Add Search To drop-down.
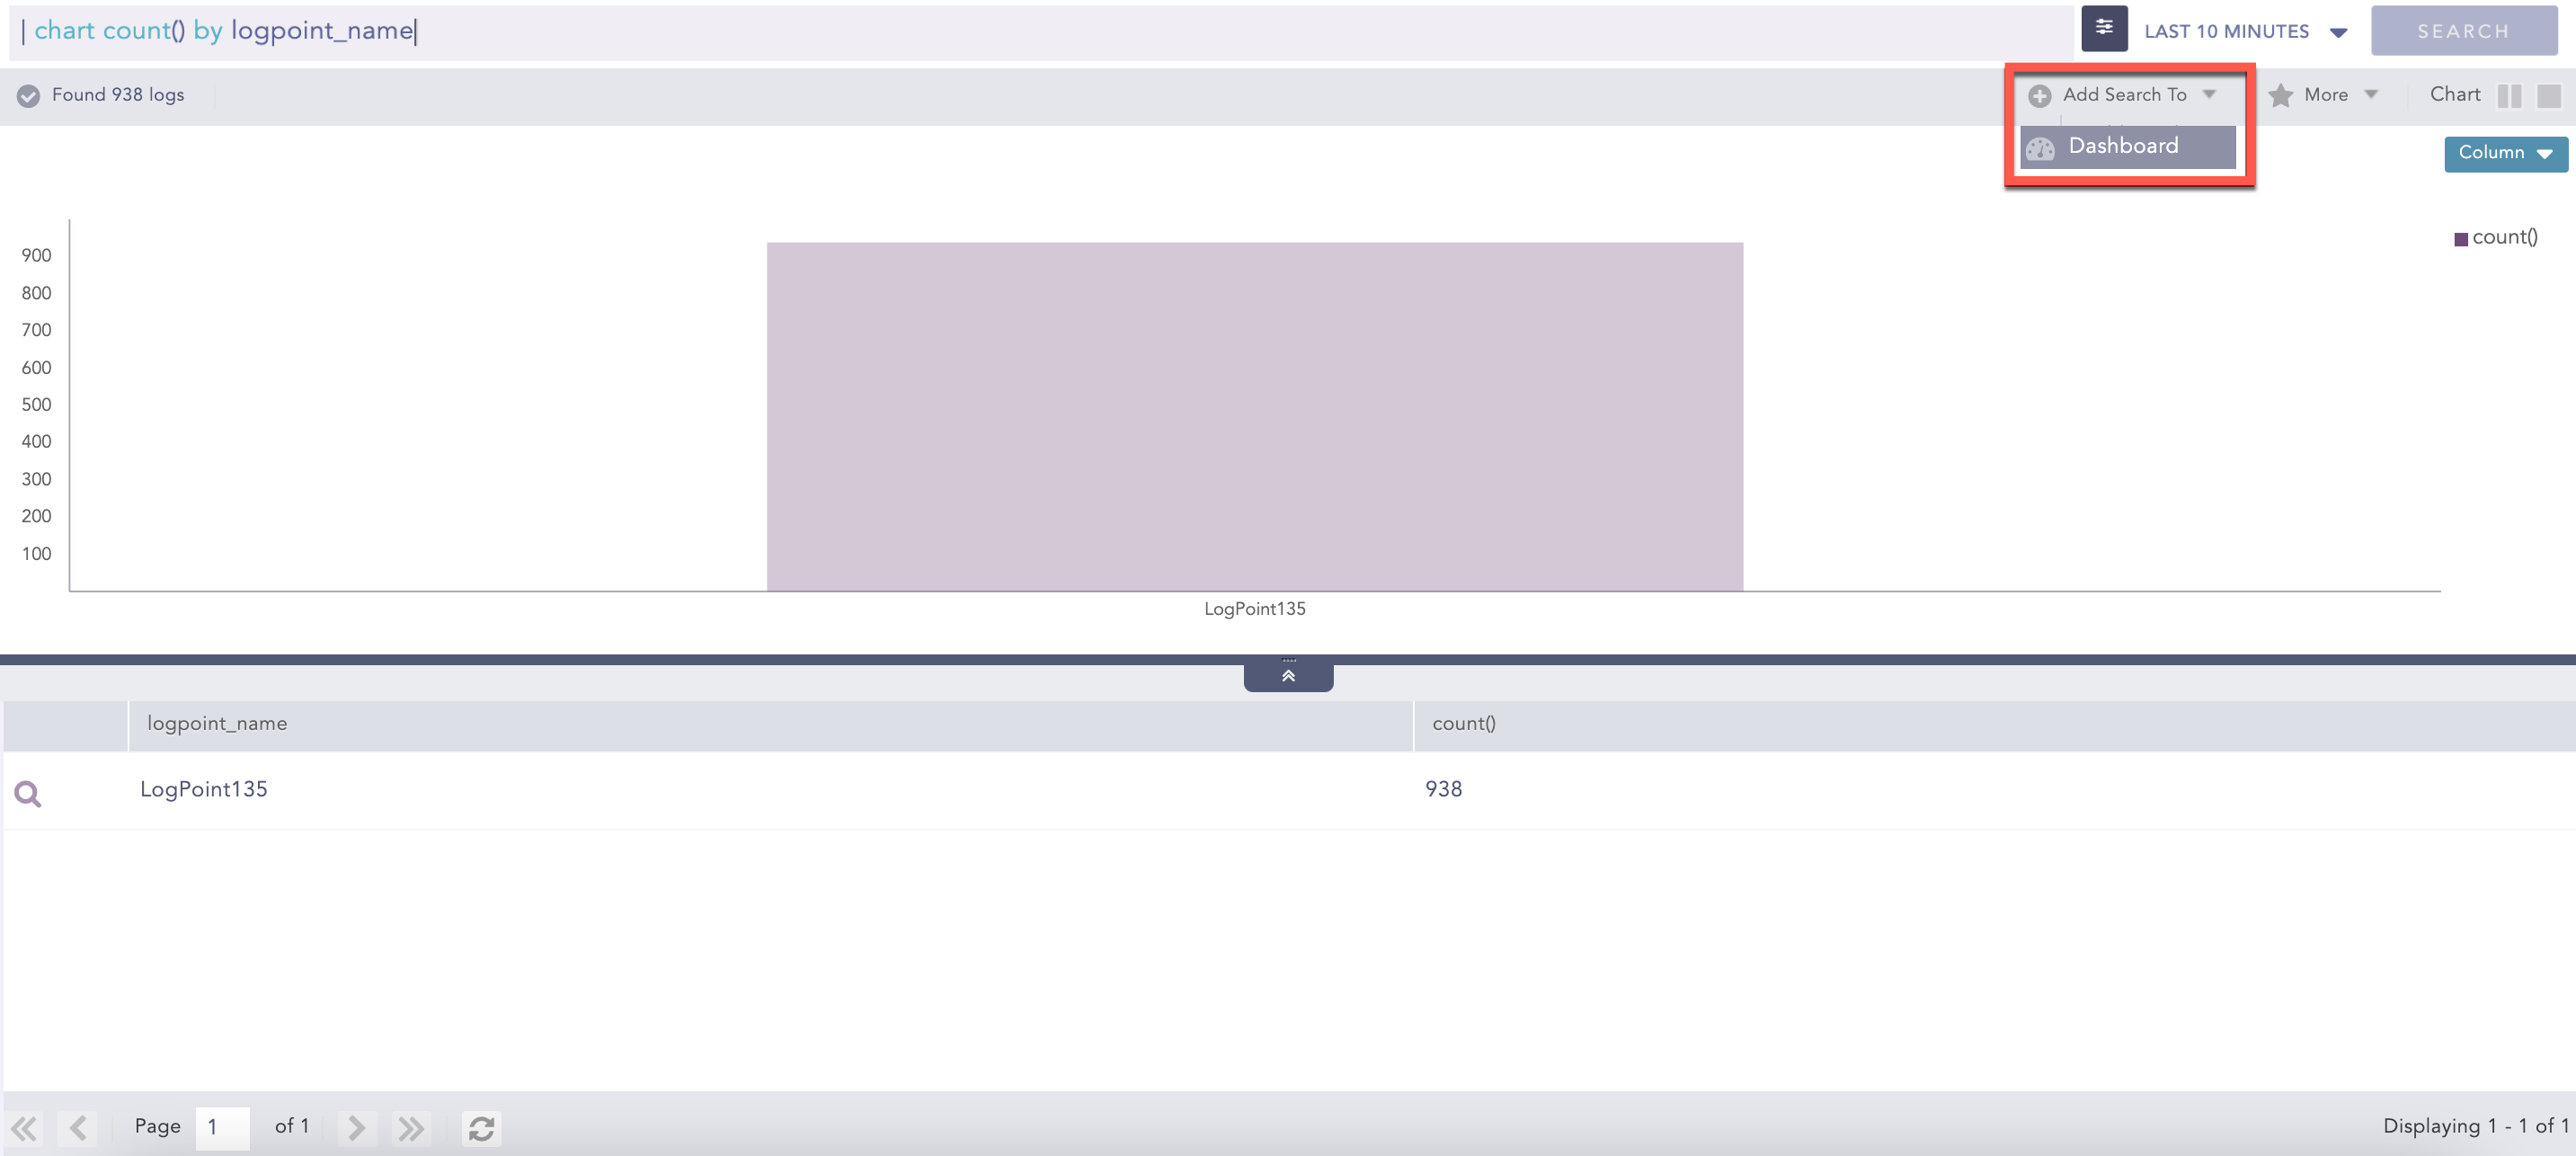
Add Search To Drop-Down
Click Dashboard.
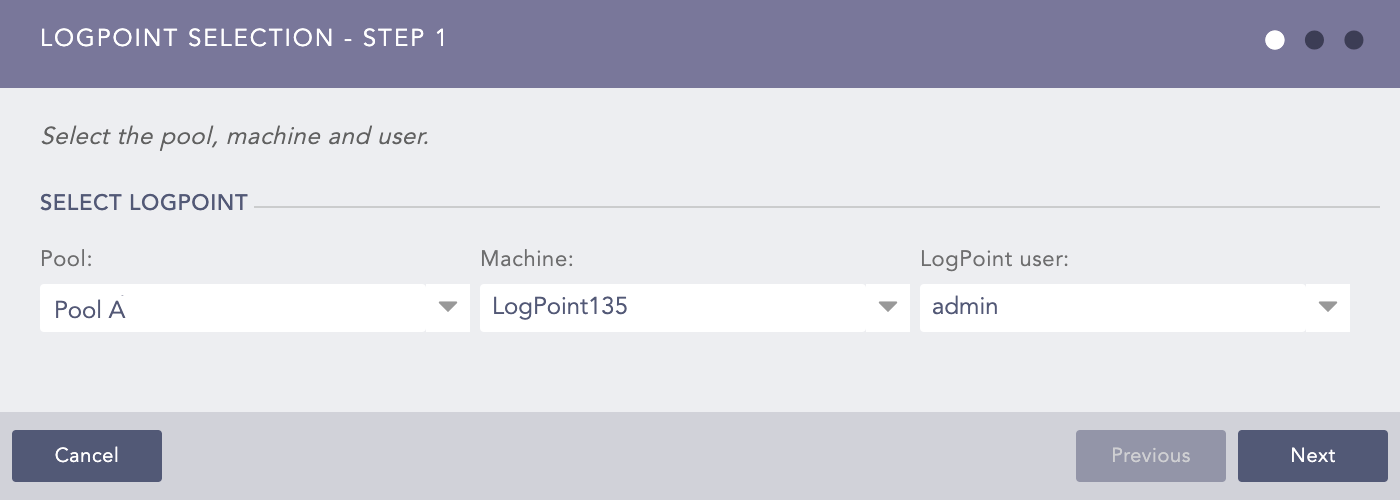
LogPoint Selection - Step 1
Select a Pool, a Machine, and a LogPoint user.
Click Next.
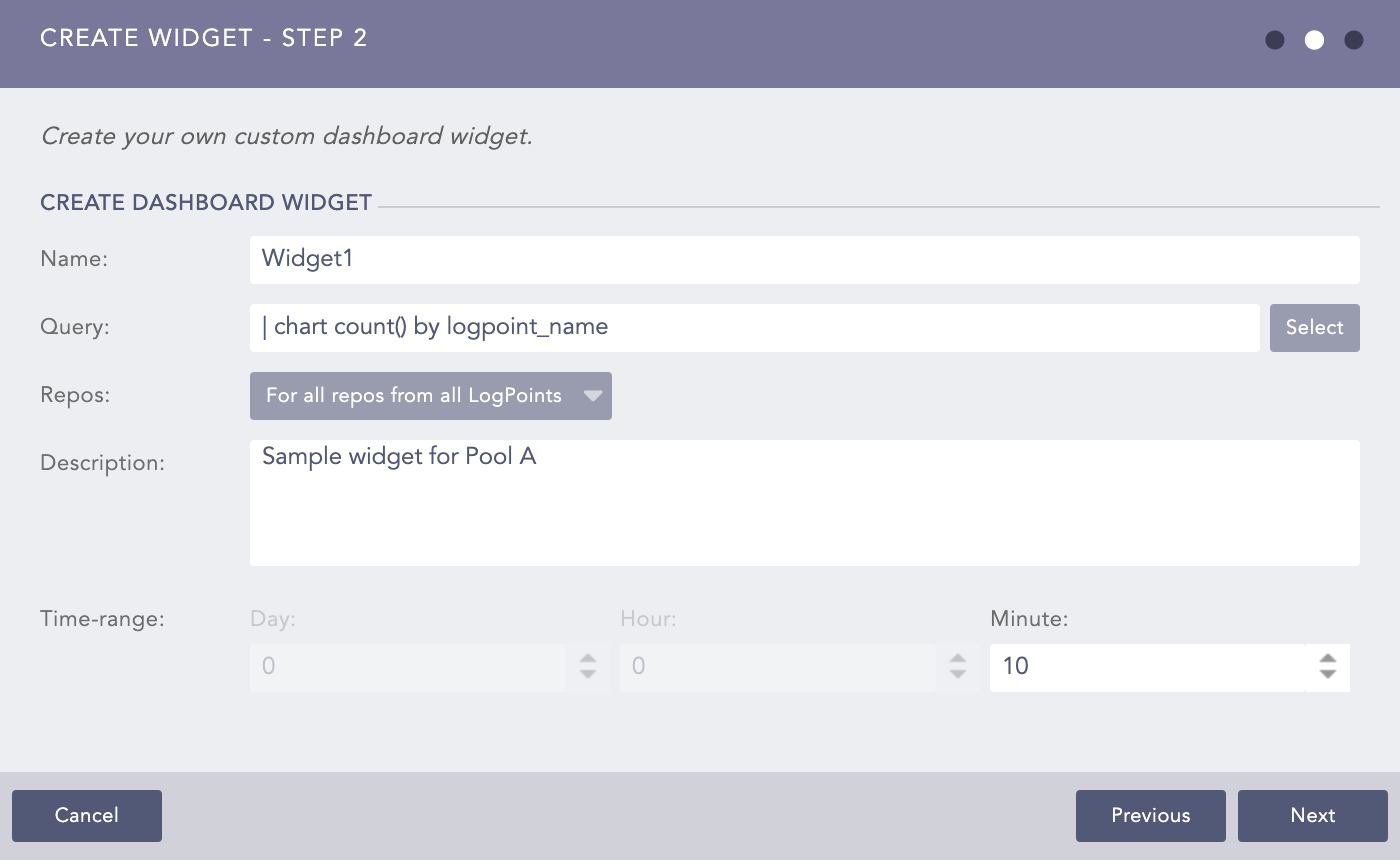
Create Widget - Step 2
Enter all the information.
Click Next.
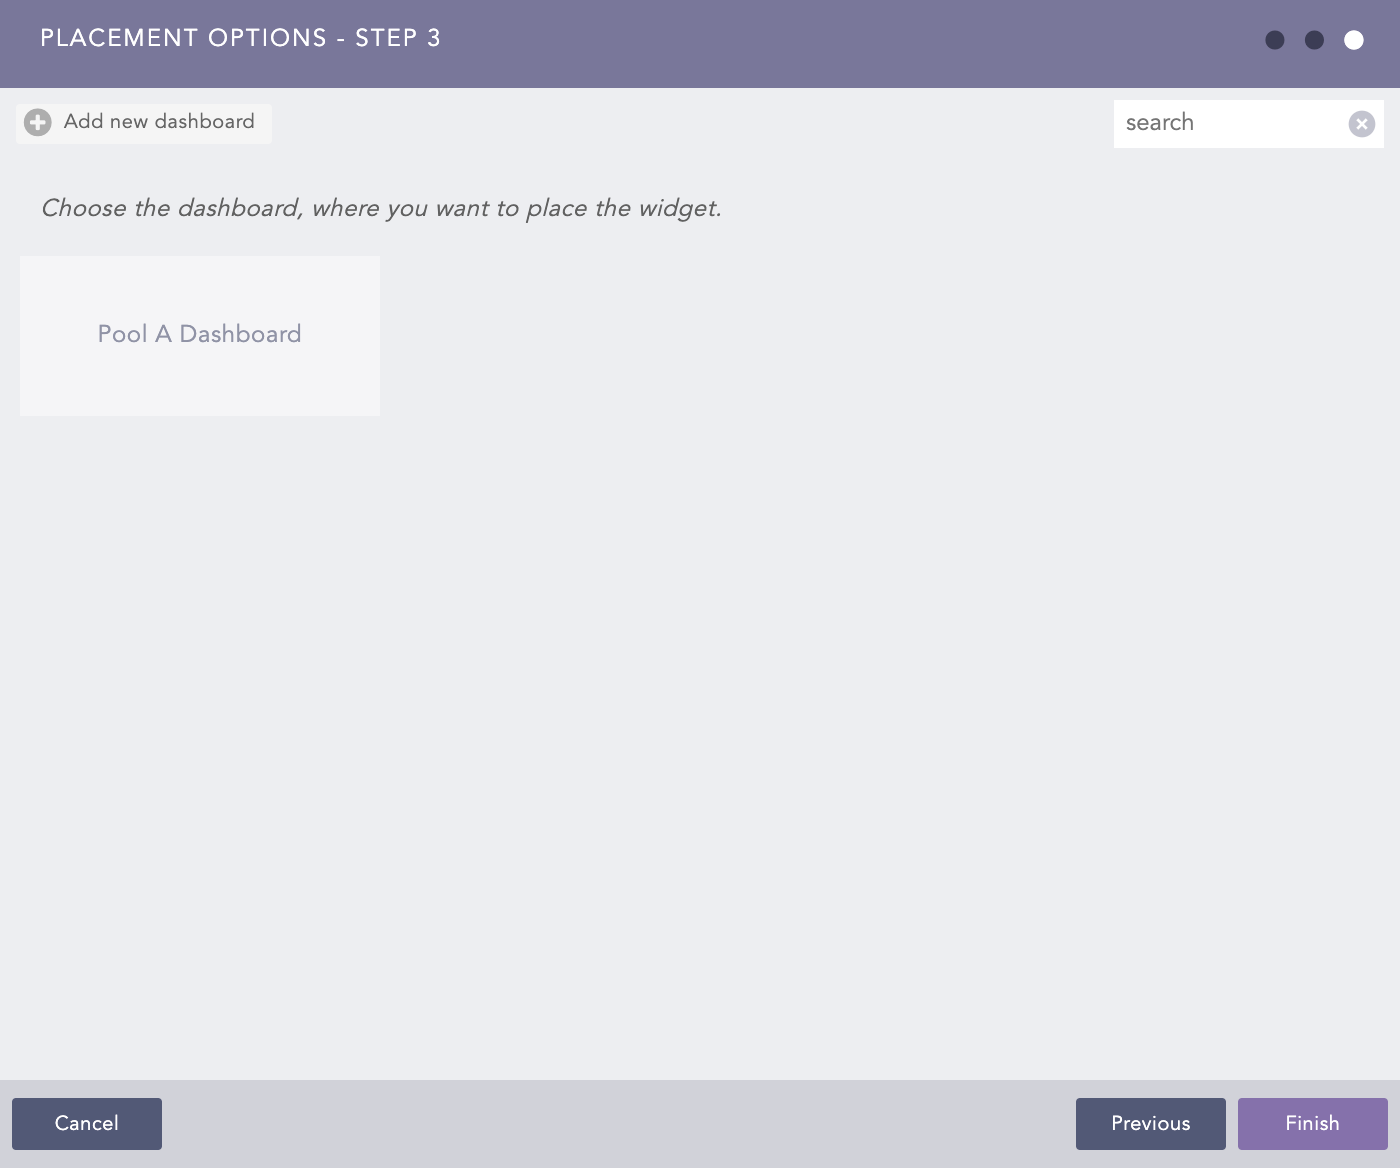
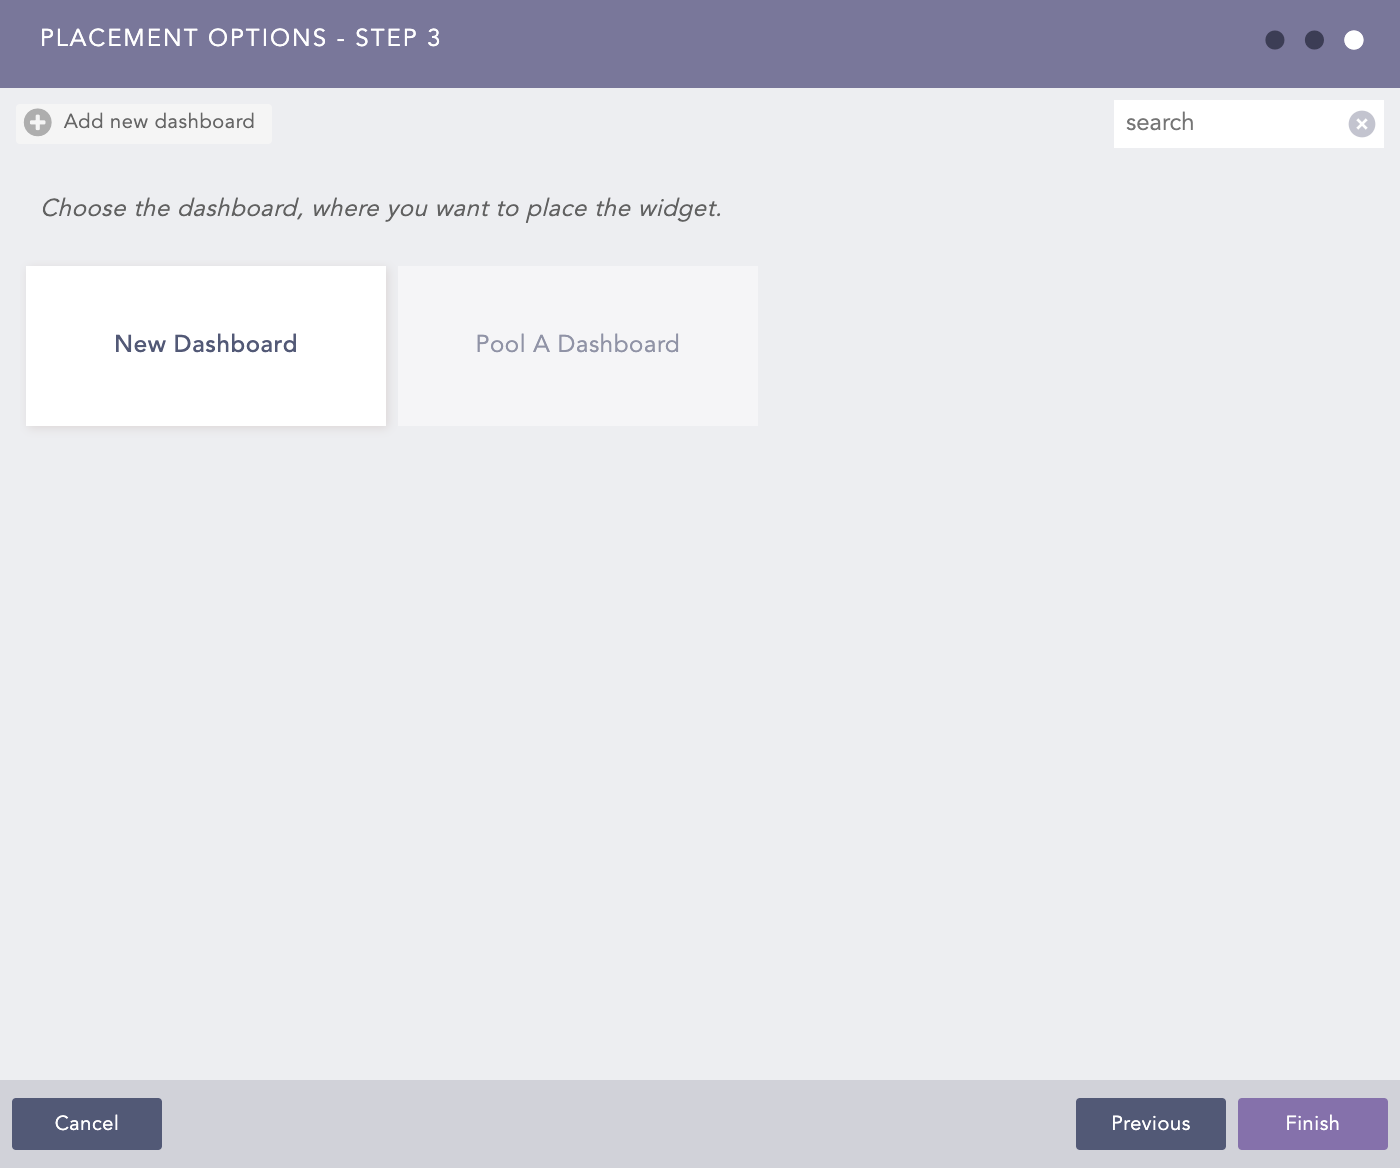
Placement Options - Step 3
The panel lists all the available dashboards for the Fabric-enabled LogPoint user selected in Step 1.
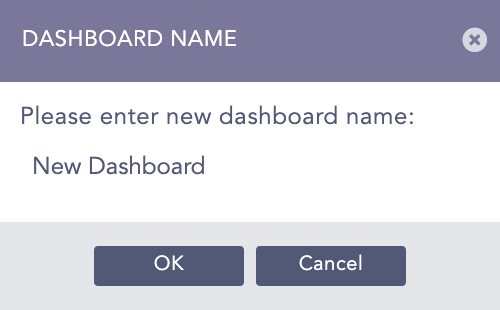
You can either select the existing dashboard to place the widget or create a new dashboard.
Click Finish.
Click Yes.
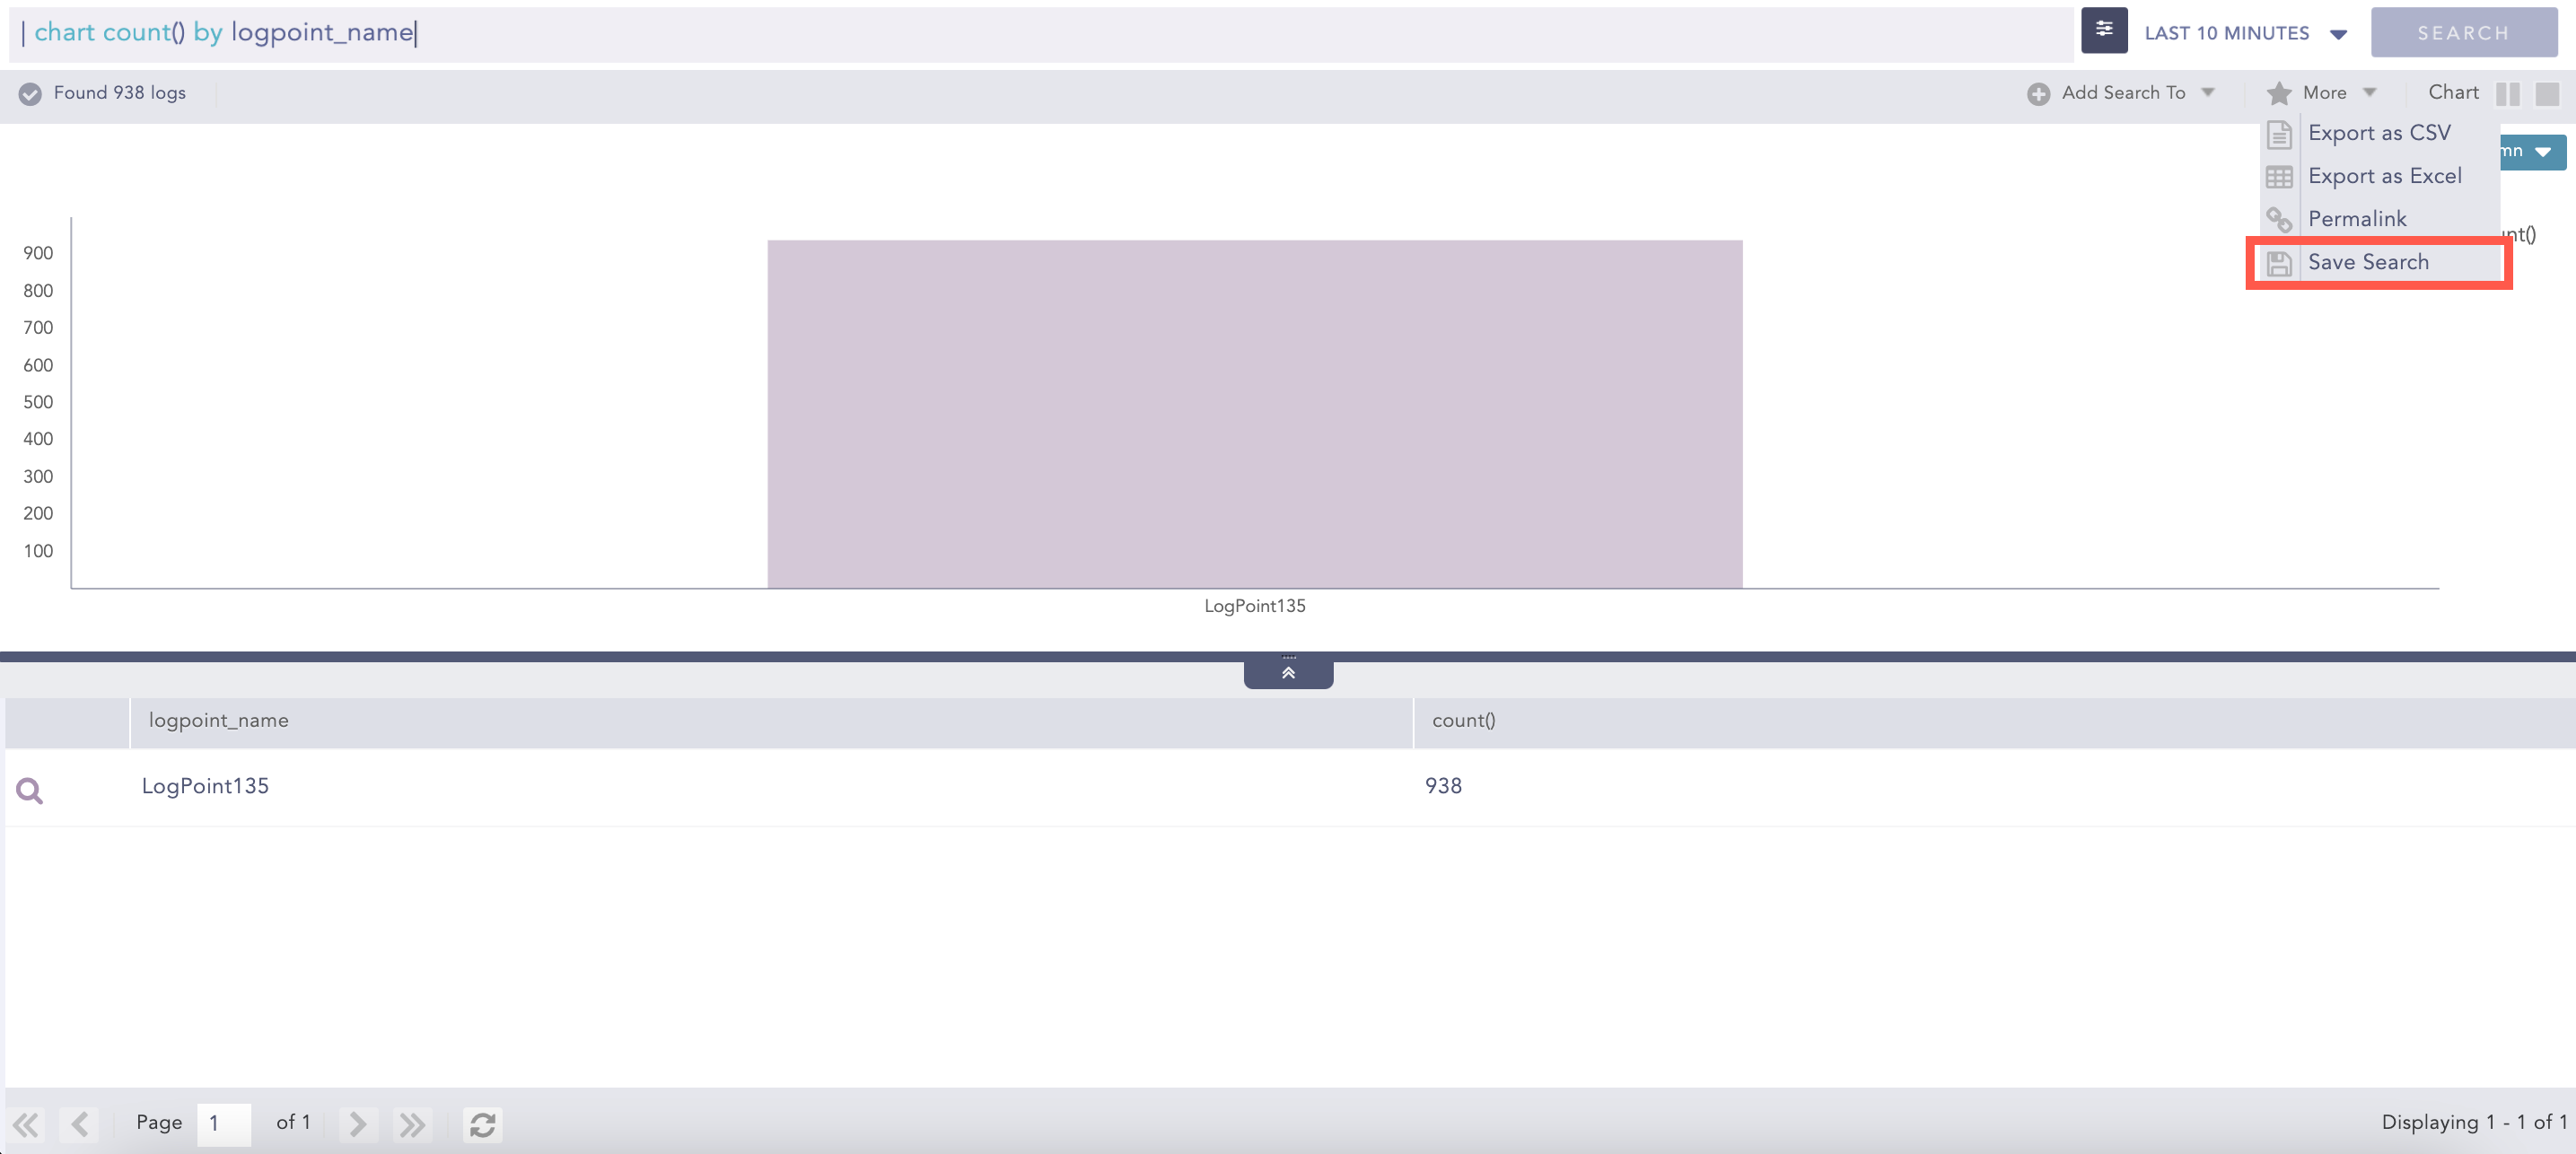
The More drop-down lists all the options that can be carried out on the results of a search query.
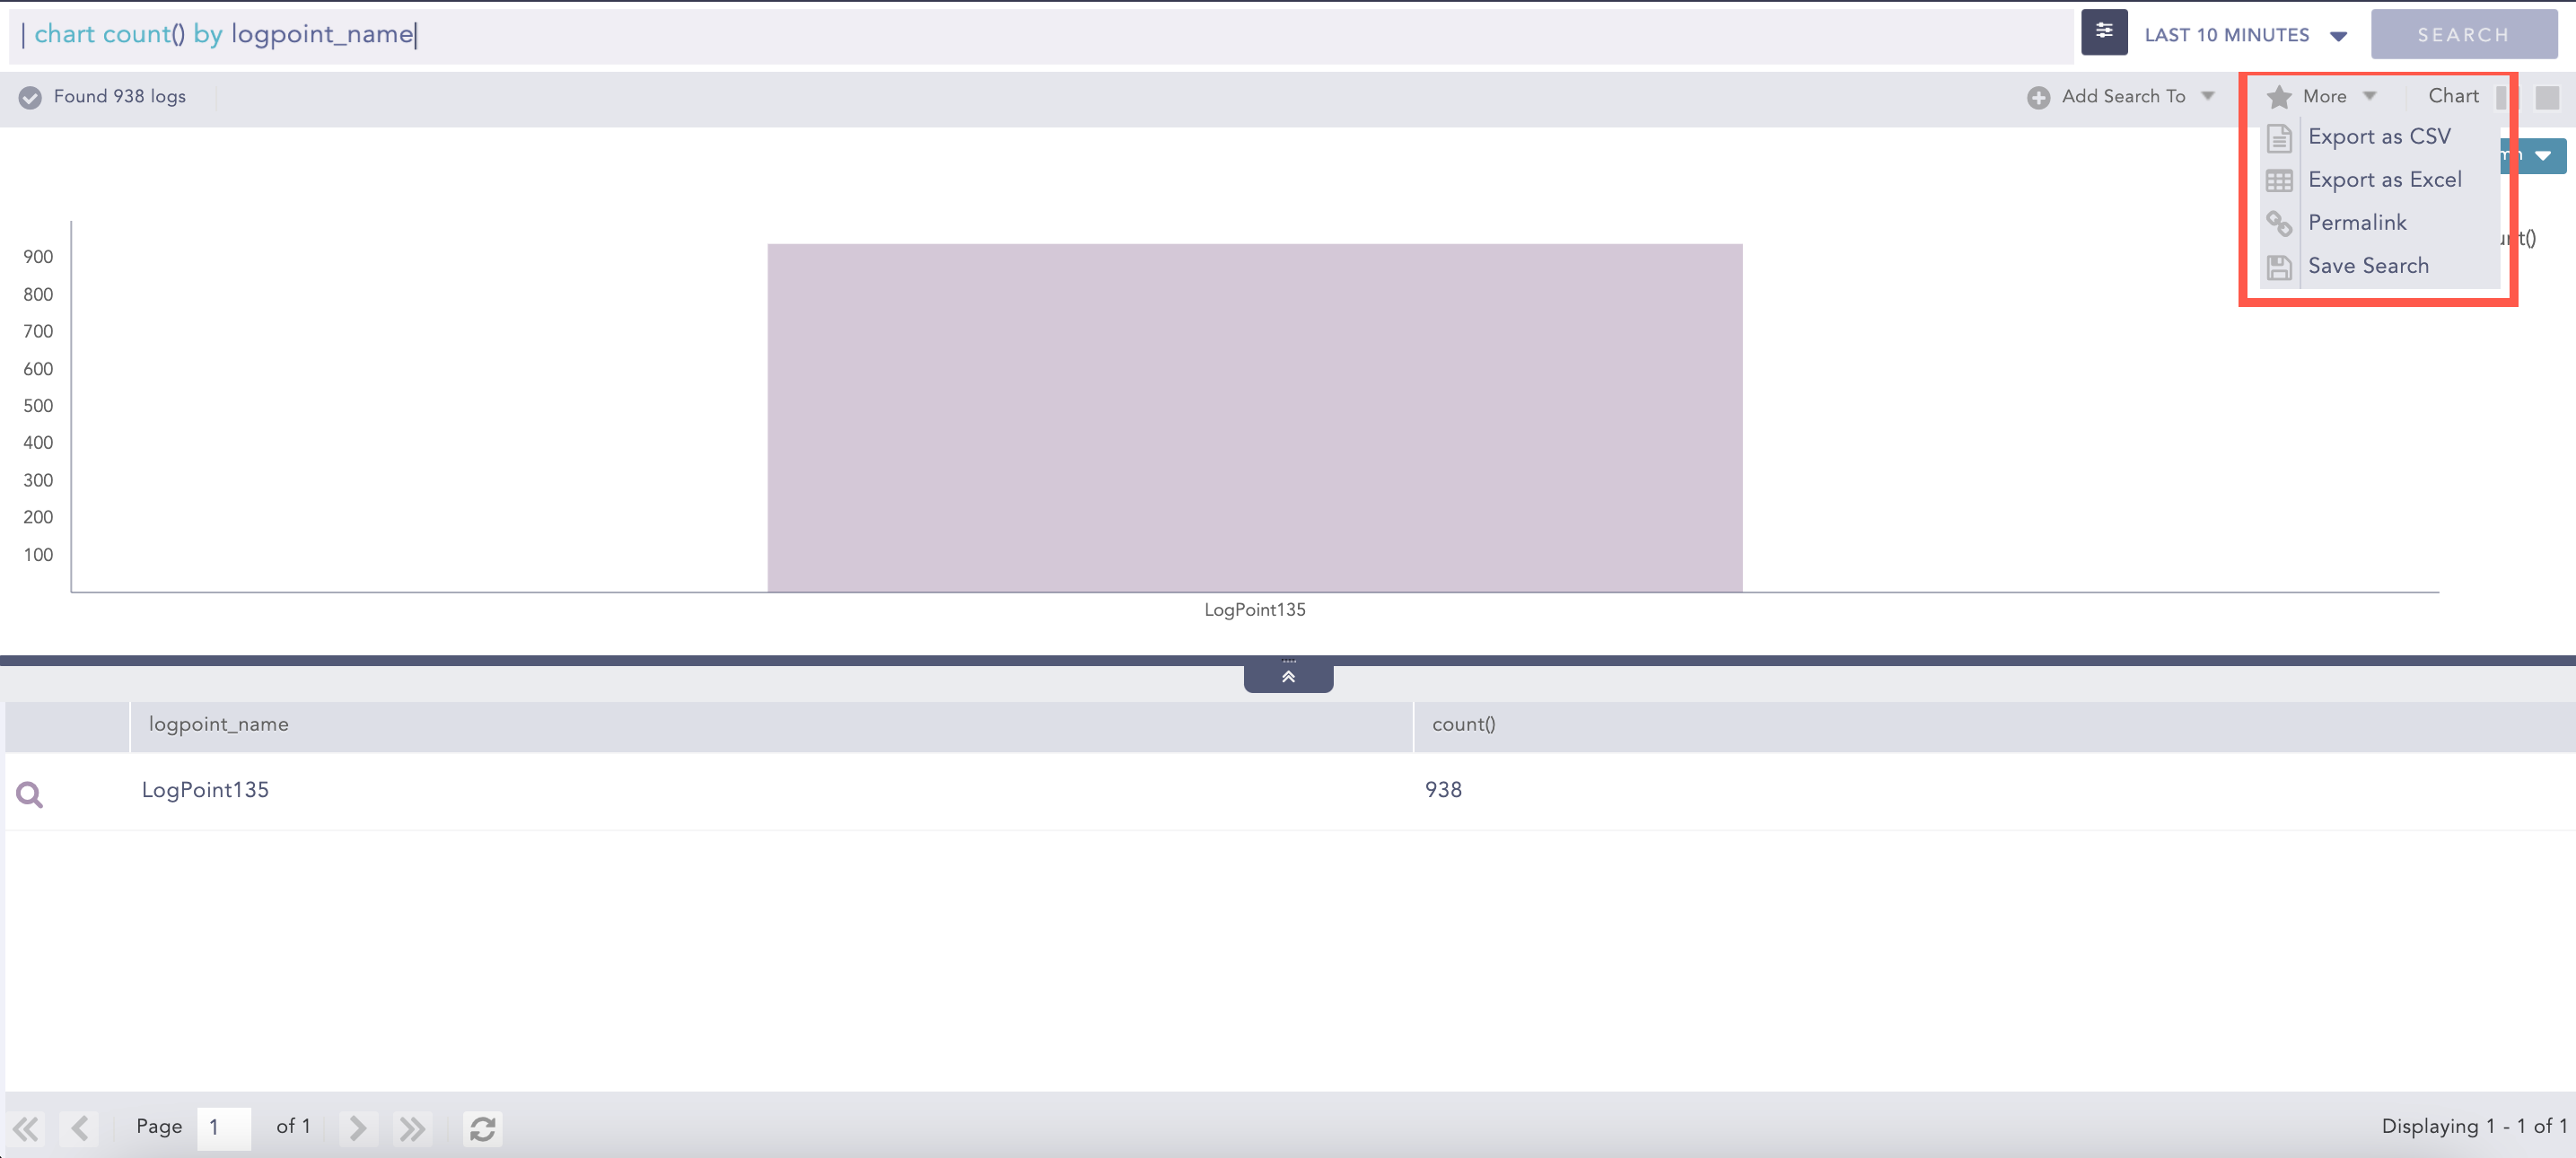
More Drop-Down
Note
For simple queries, you can use the Permalink and Save Search options only. For aggregated queries, you can use all the options.
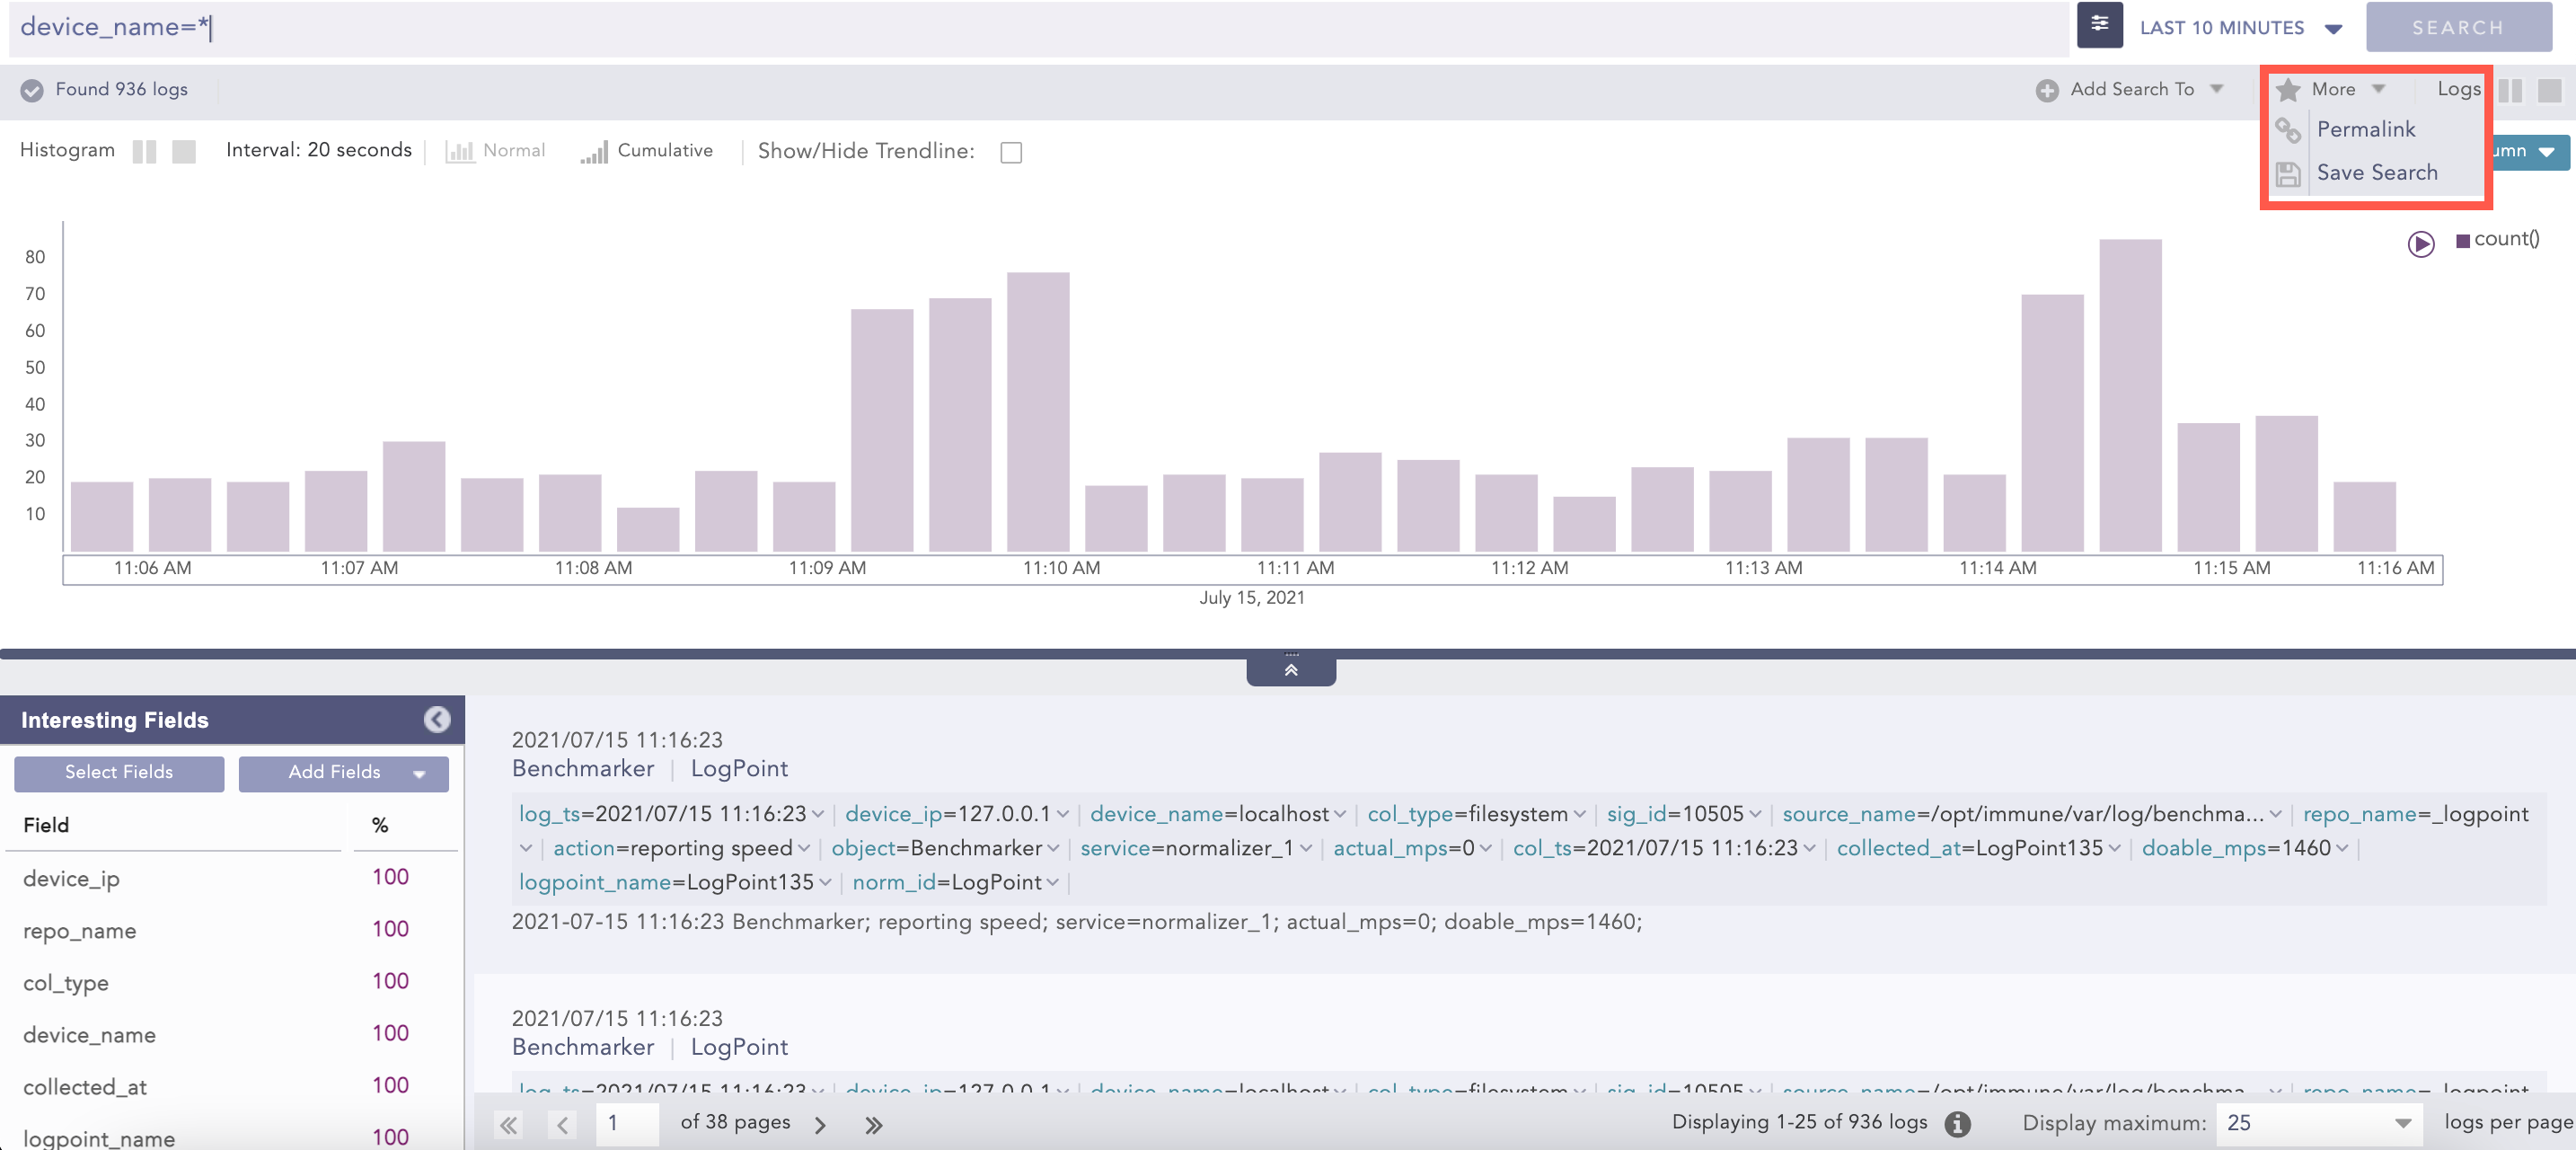
More Options for Simple Queries
Export as CSV lets you export the search results in the CSV format.
Go to the Search page.
Enter an aggregated Search Query in the search bar and click Search.
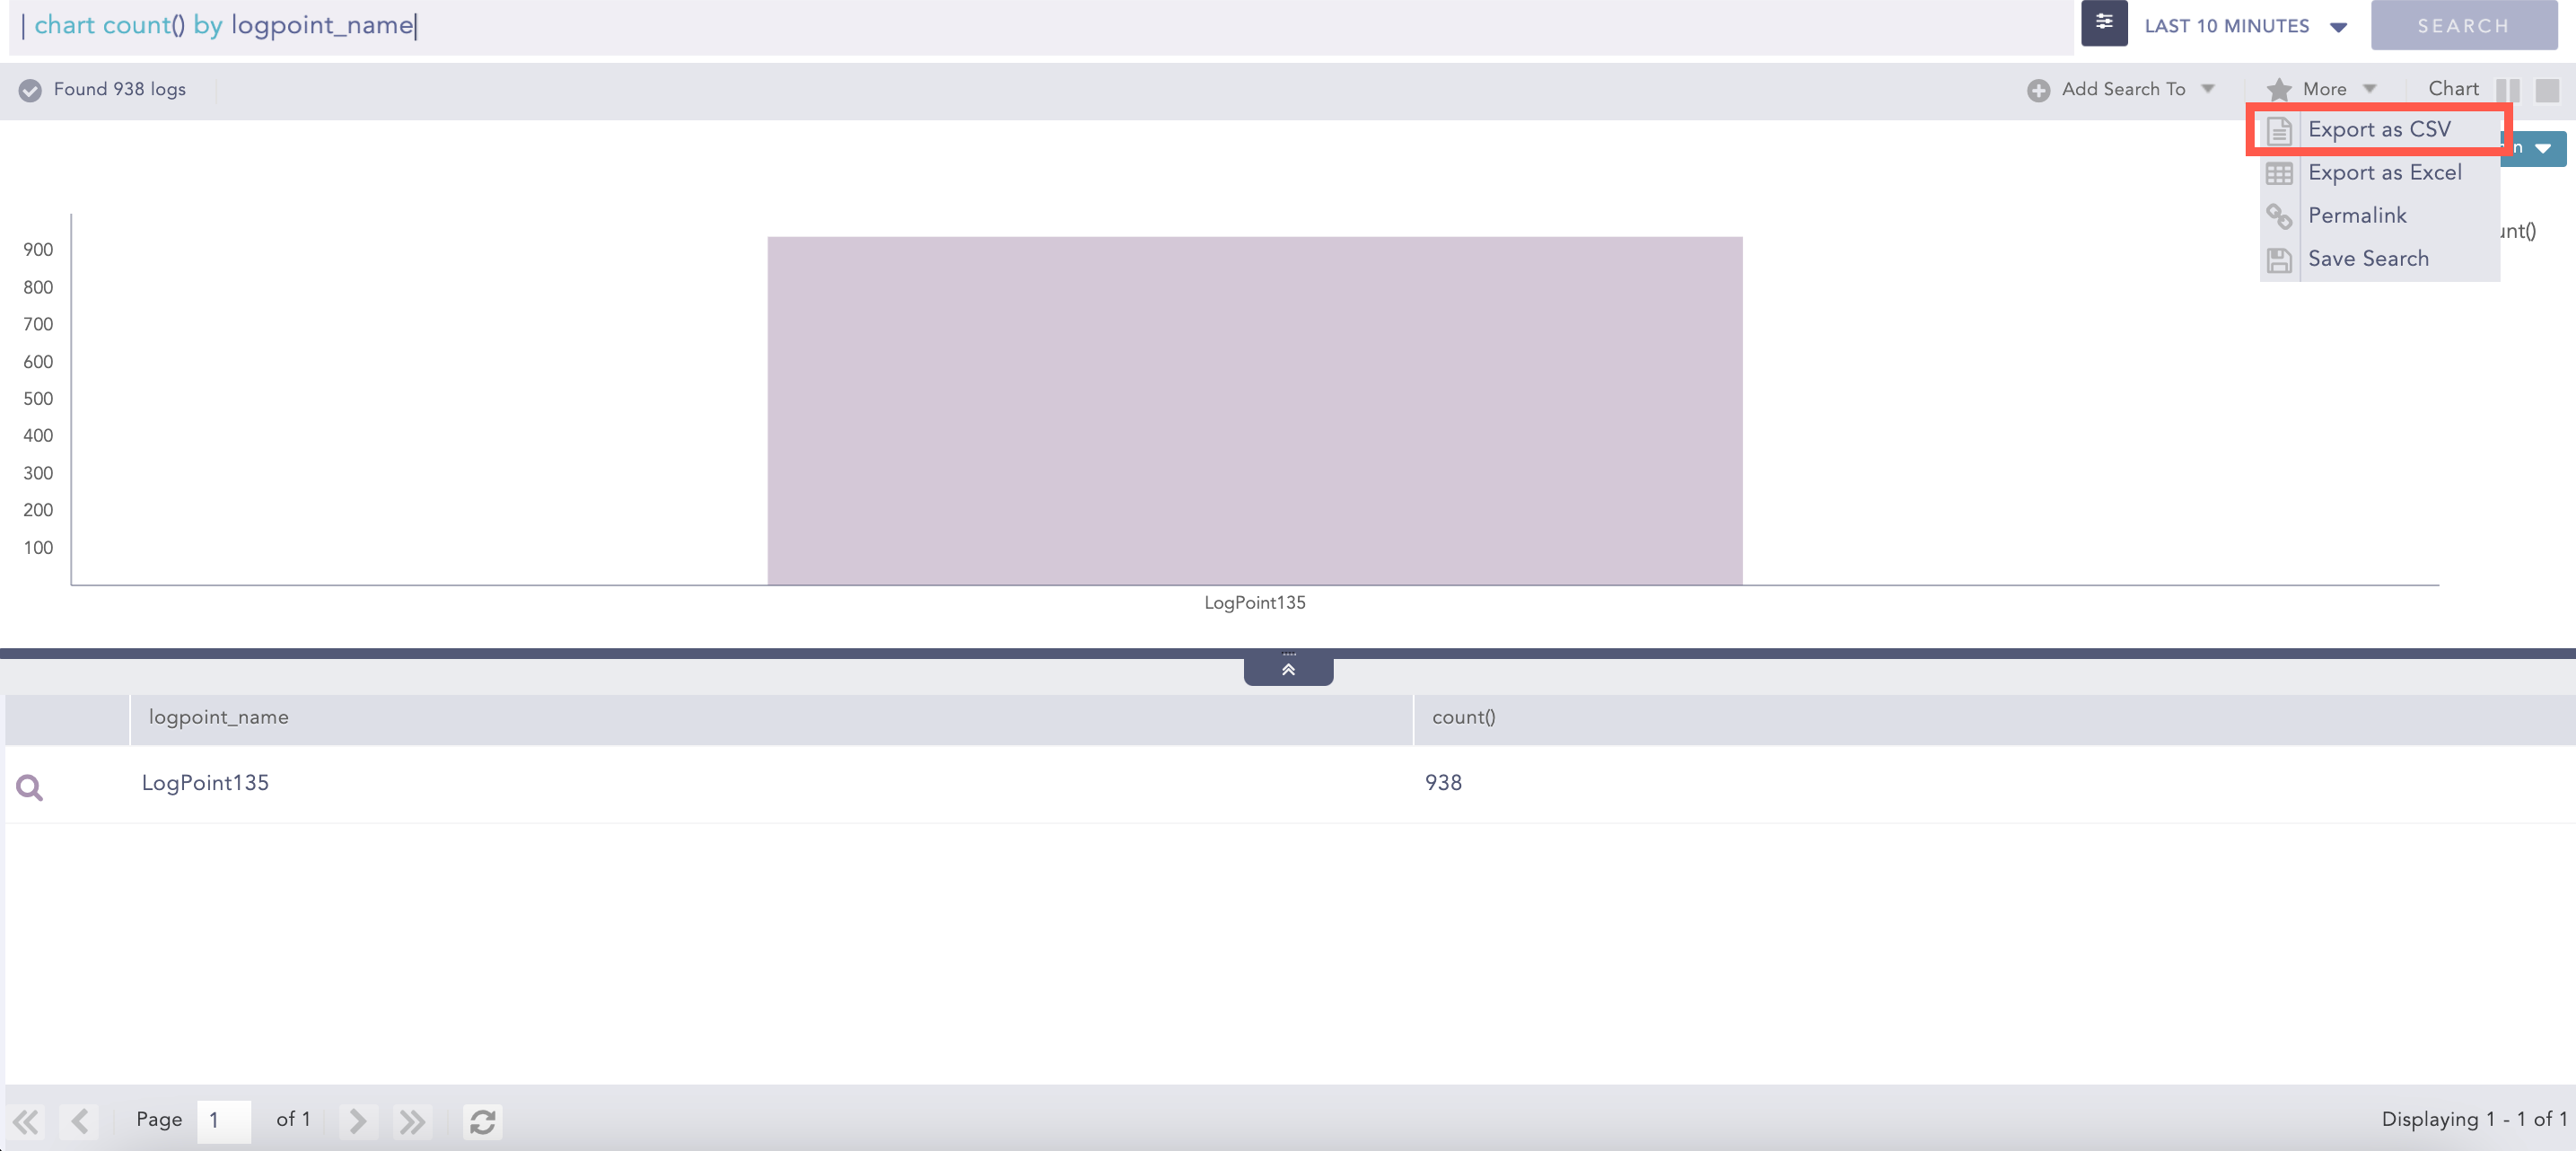
Export as CSV
Select Export as CSV from the More drop-down.
Export as Excel lets you export the search results in the Excel format.
Go to the Search page.
Enter an aggregated Search Query in the search bar and click Search.
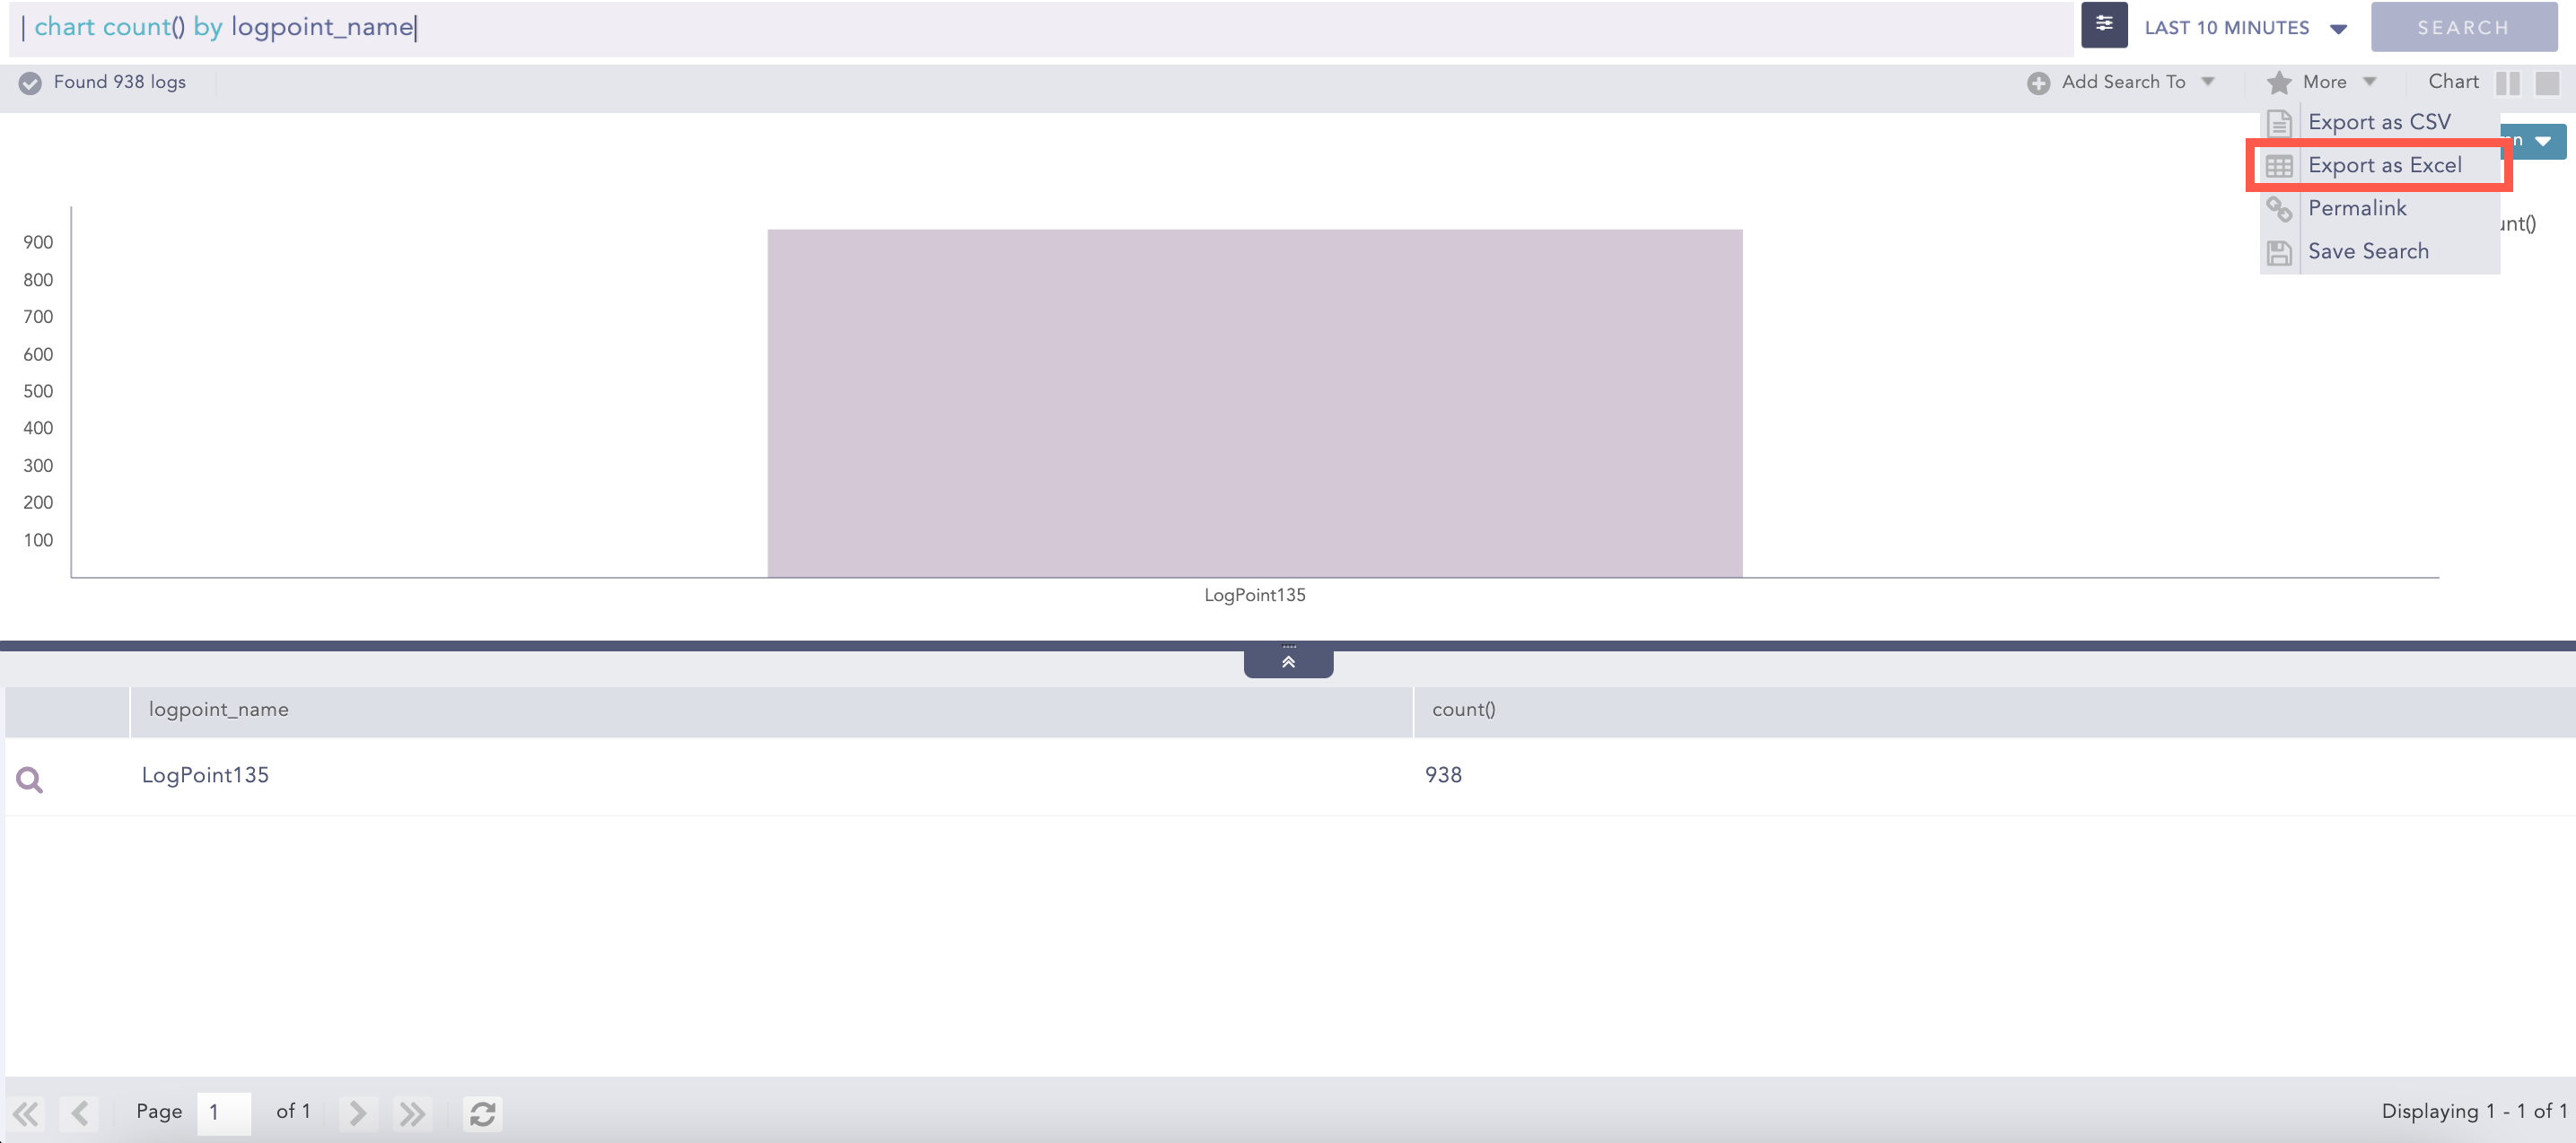
Export as Excel
Select Export as Excel from the More drop-down.
Permalink gives you a complete URL required to generate the current search. You can share the link with other users in the system to make an exact and similar search.
Go to the Search page.
Enter a Search Query in the search bar and click Search.
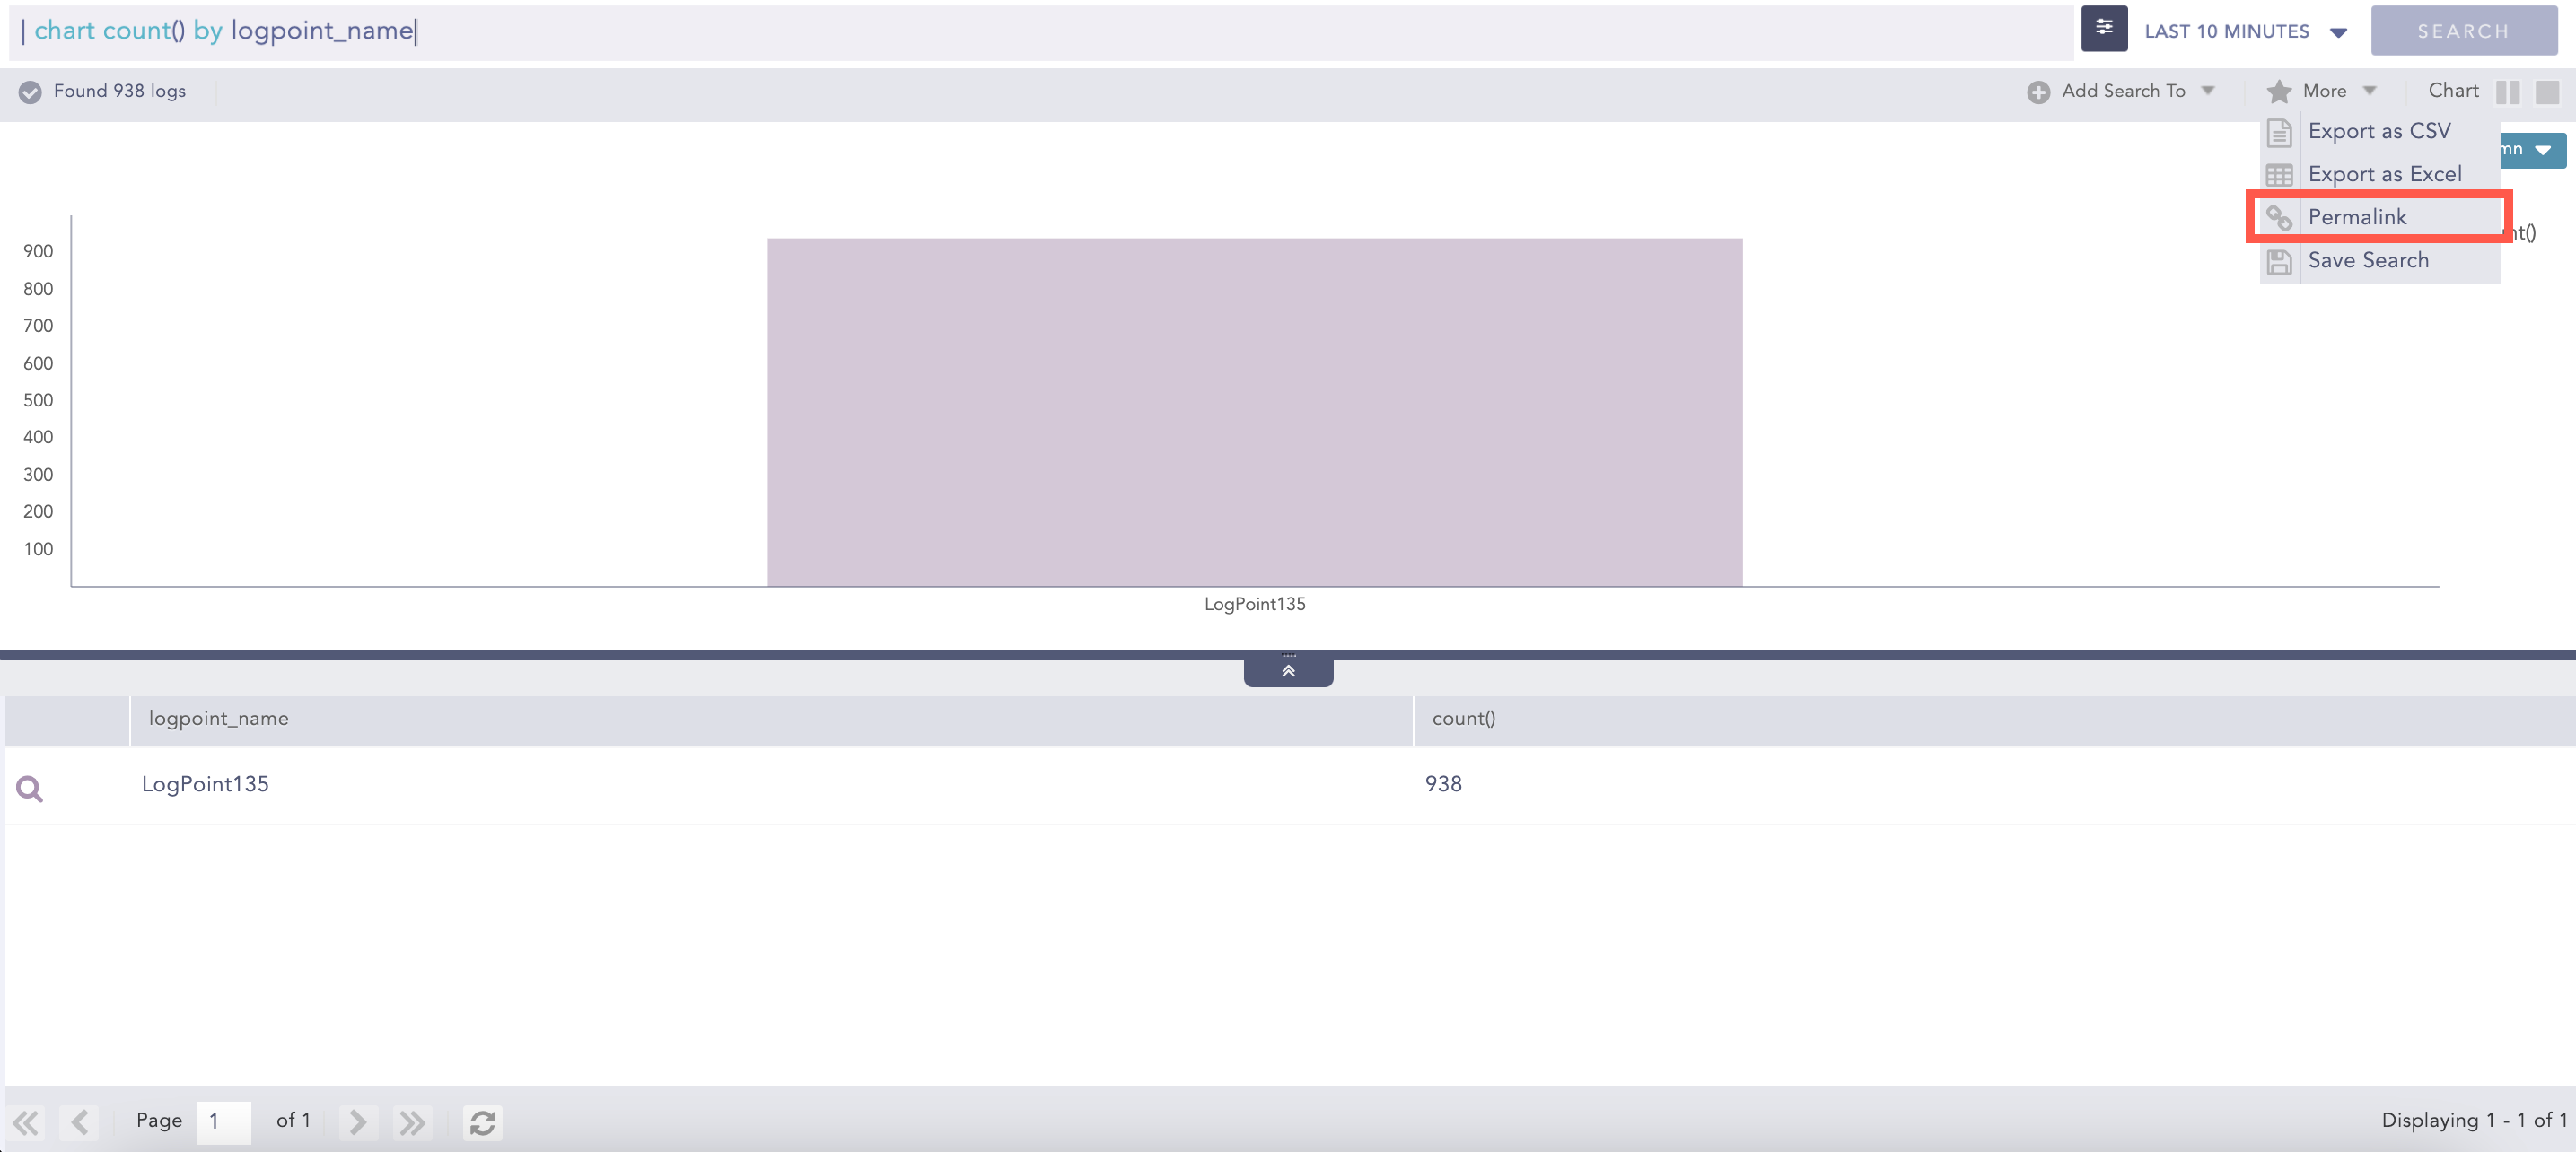
Permalink
Select Permalink from the More drop-down.
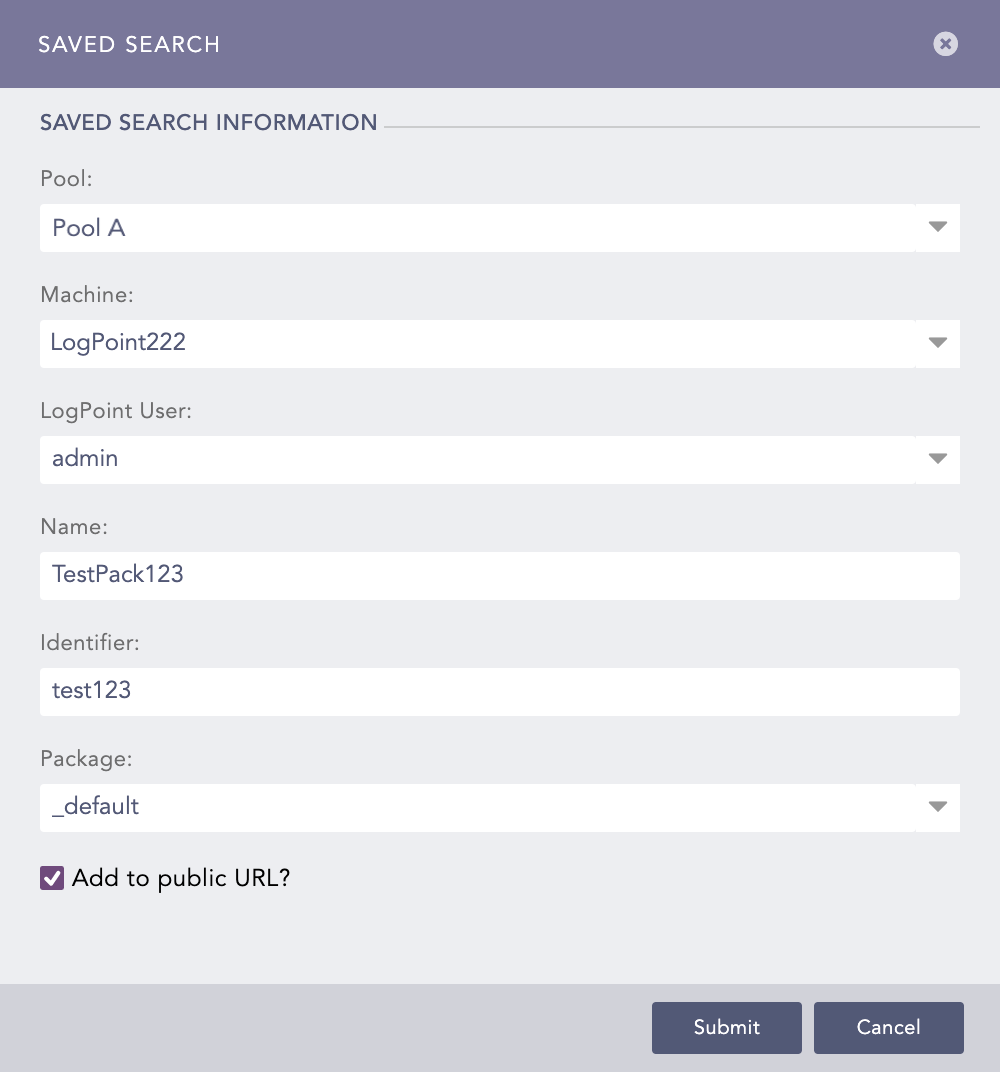
Save Search lets you save your current search. You can view the Saved Searches in the Search page from the My Saved Searches section.